Featured plate · Macro ·
Fed timeline: 5.25%-5.50% ranks second
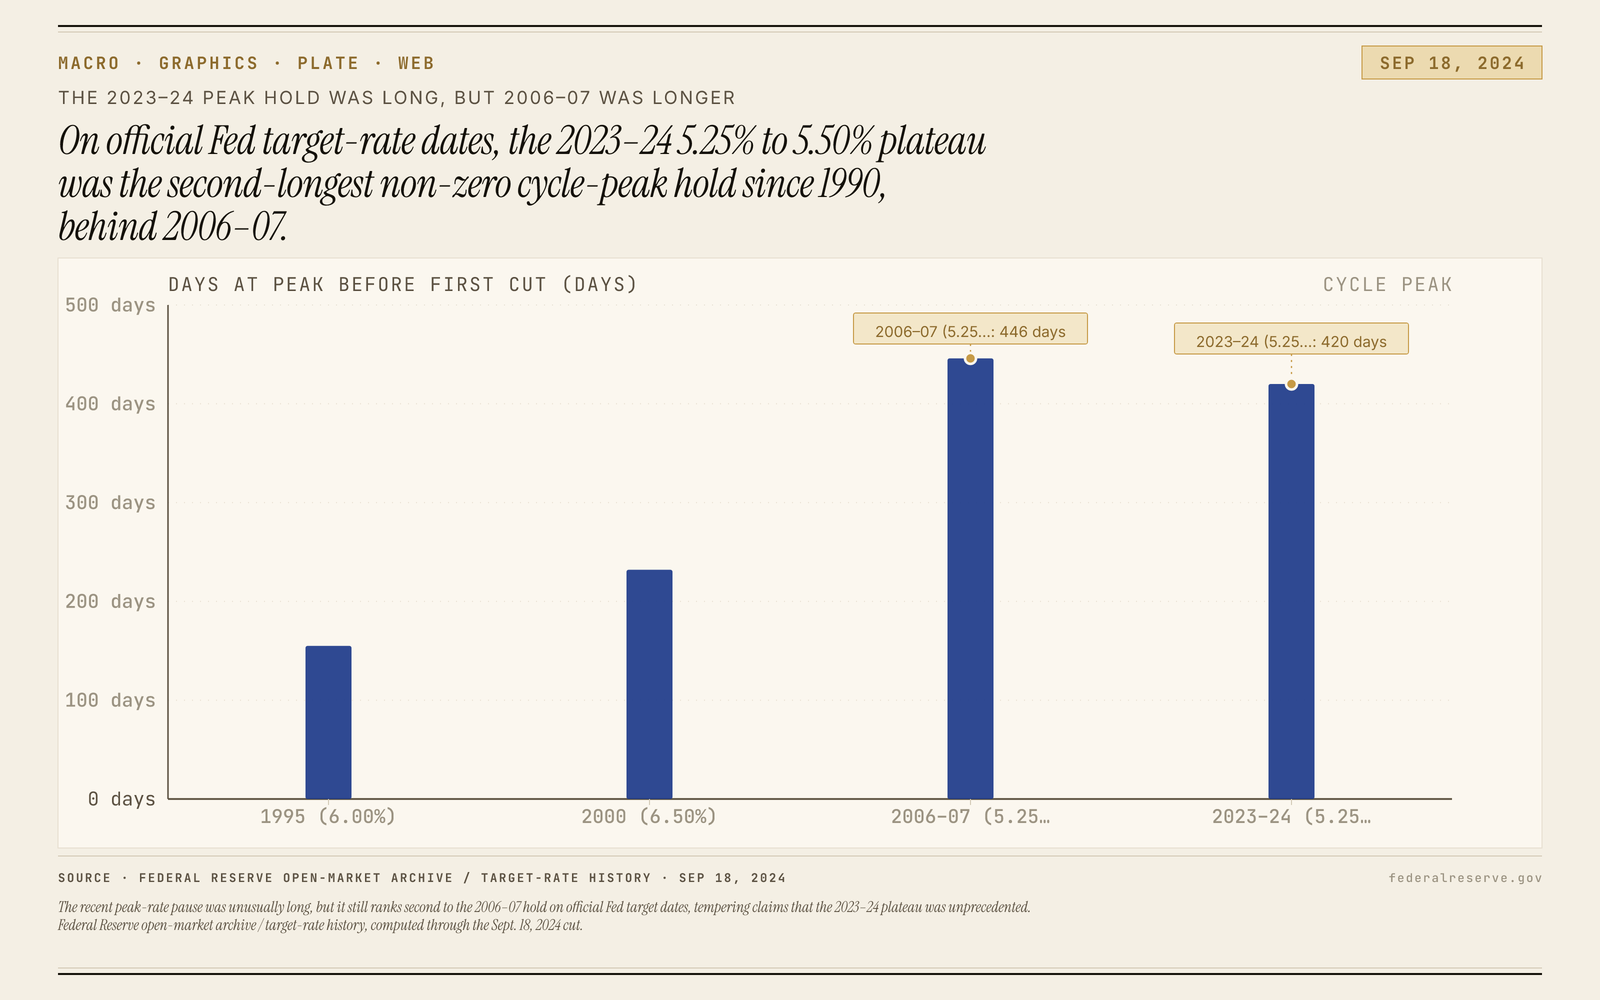
A pause at the top can look unprecedented until each peak is measured on the Fed’s own target-rate dates.
- Plate 11
Fed timeline: 5.25%-5.50% ranks second
A pause at the top can look unprecedented until each peak is measured on the Fed’s own target-rate dates.
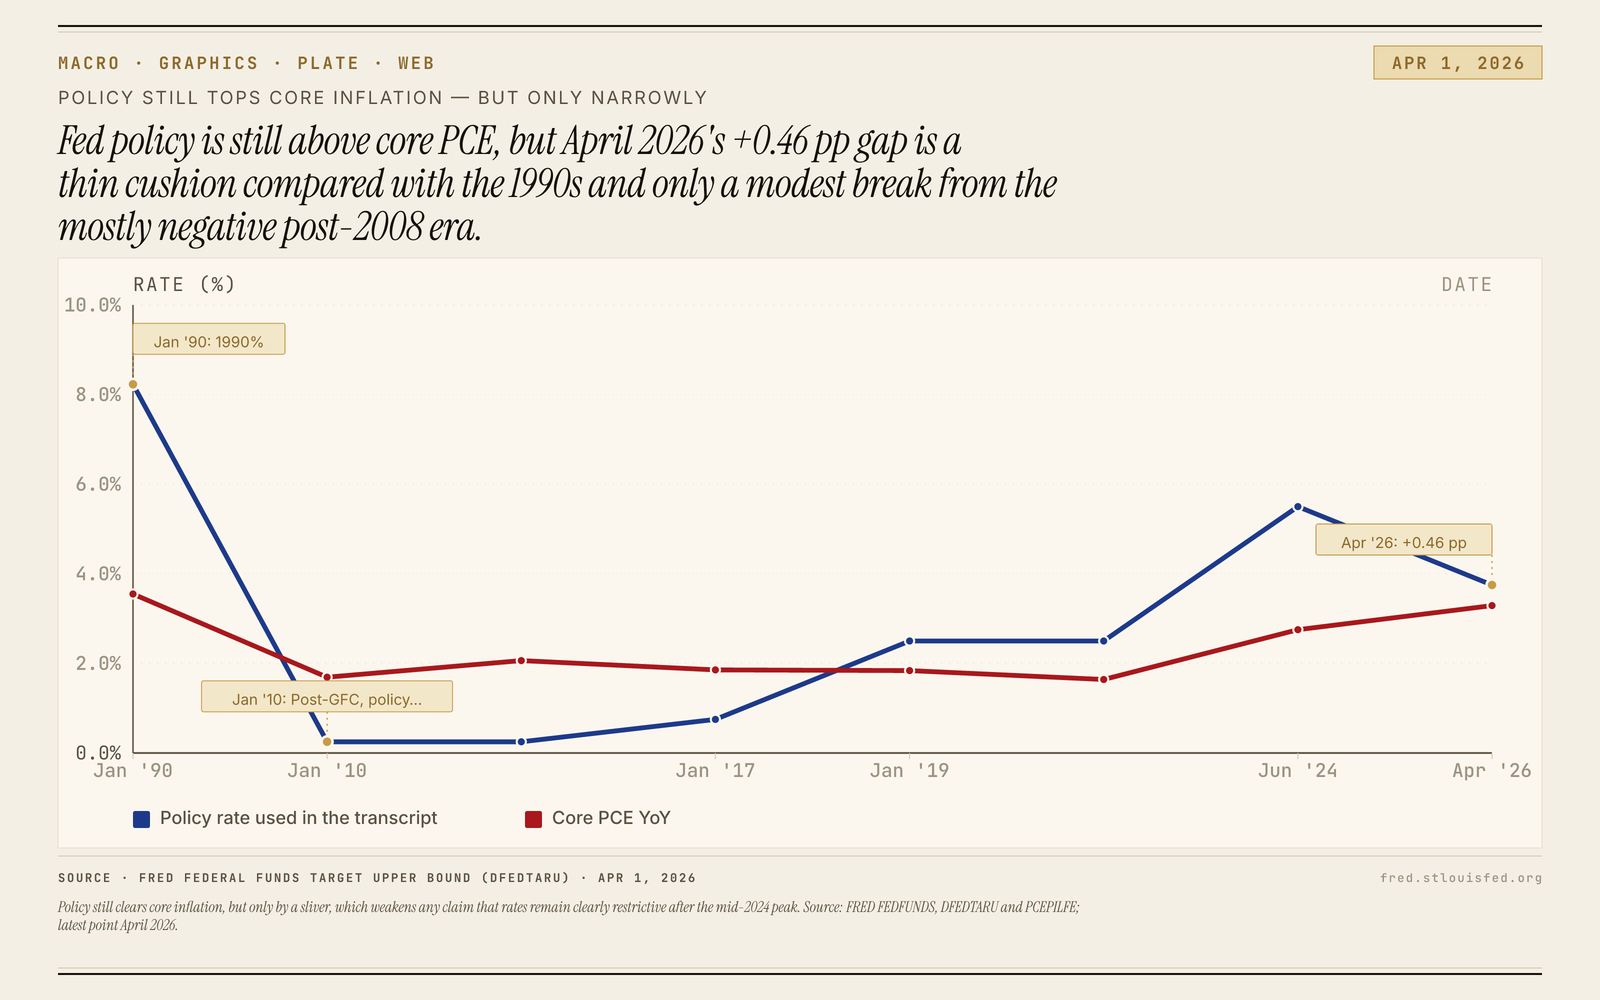 Plate 10
Policy Rate Barely Tops Core PCE
The chart shows the policy rate still above core PCE by +0.46 pp.
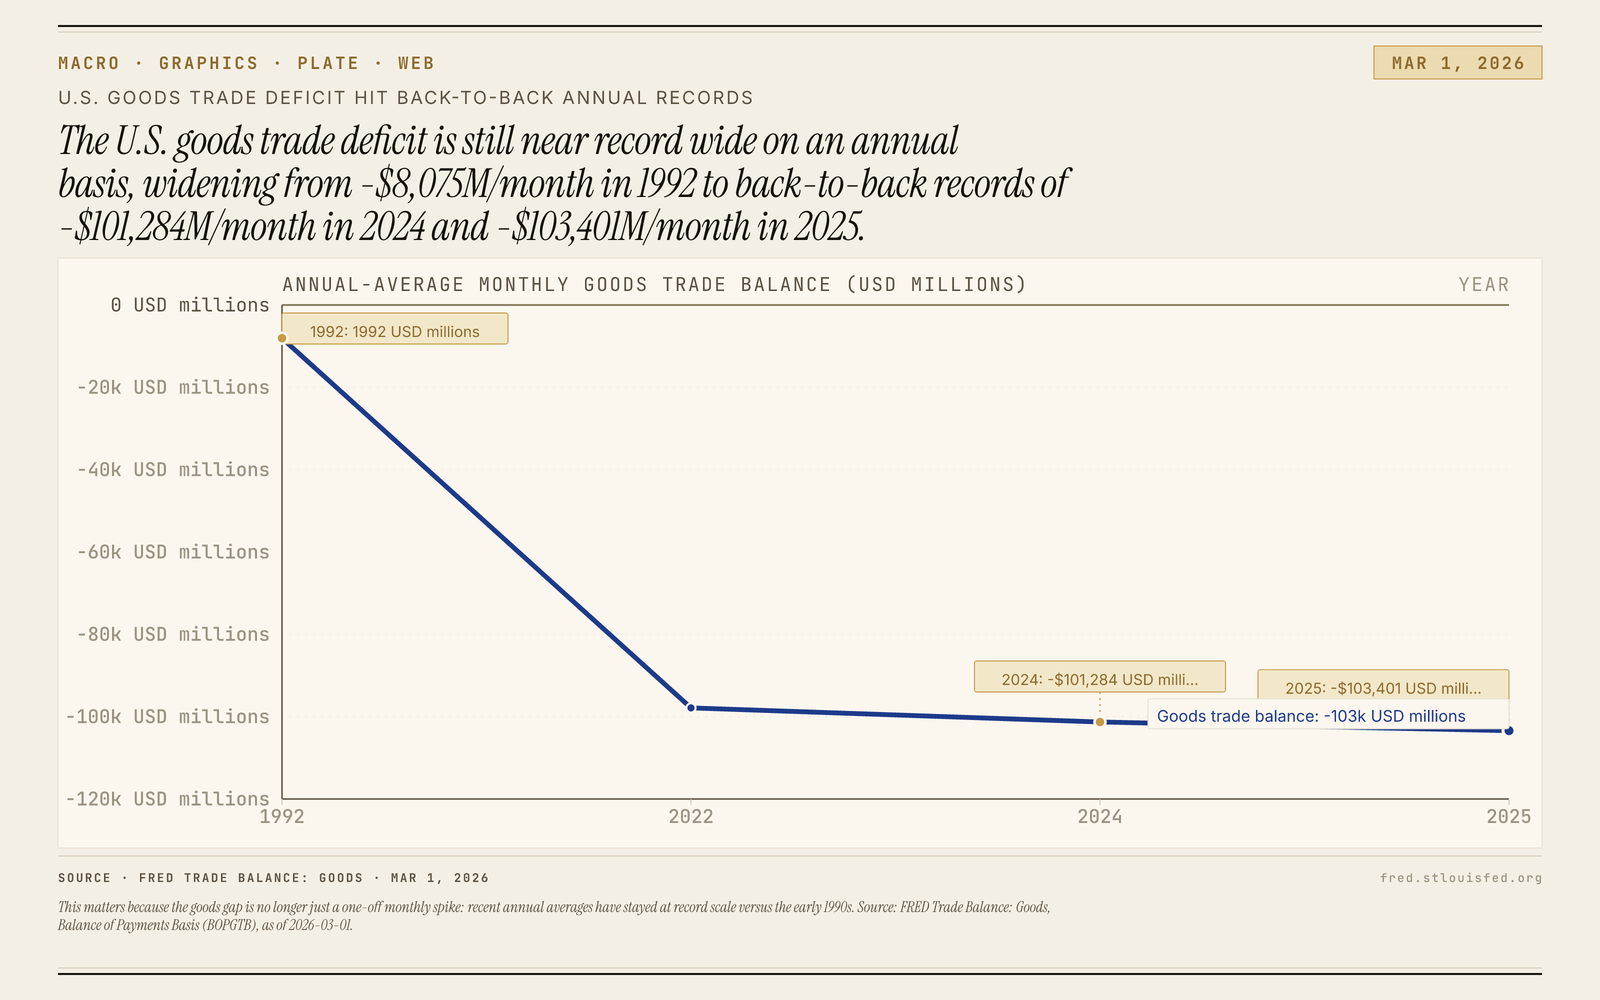 Plate 09
Goods deficit near annual records
This chart shows the U.S.
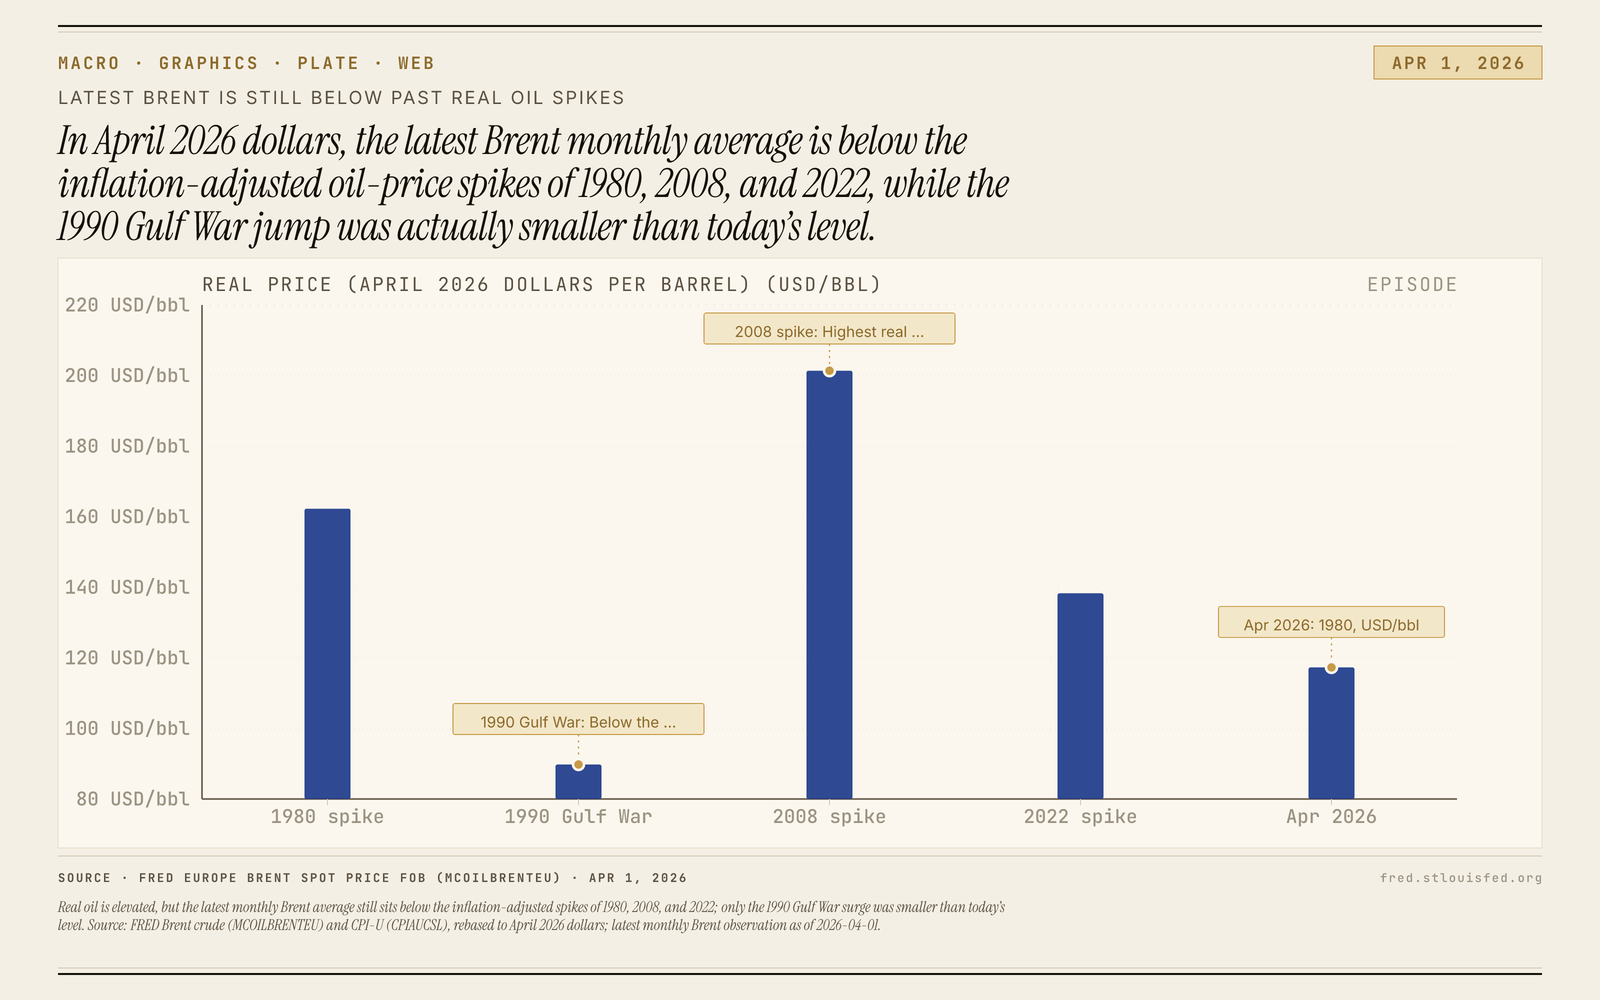 Plate 08
Real Brent Below Prior Oil Shock Peaks
This chart puts selected oil shocks on the same constant-dollar yardstick, comparing the latest Brent monthly average with earlier crisis episodes rather than live spot headlines.
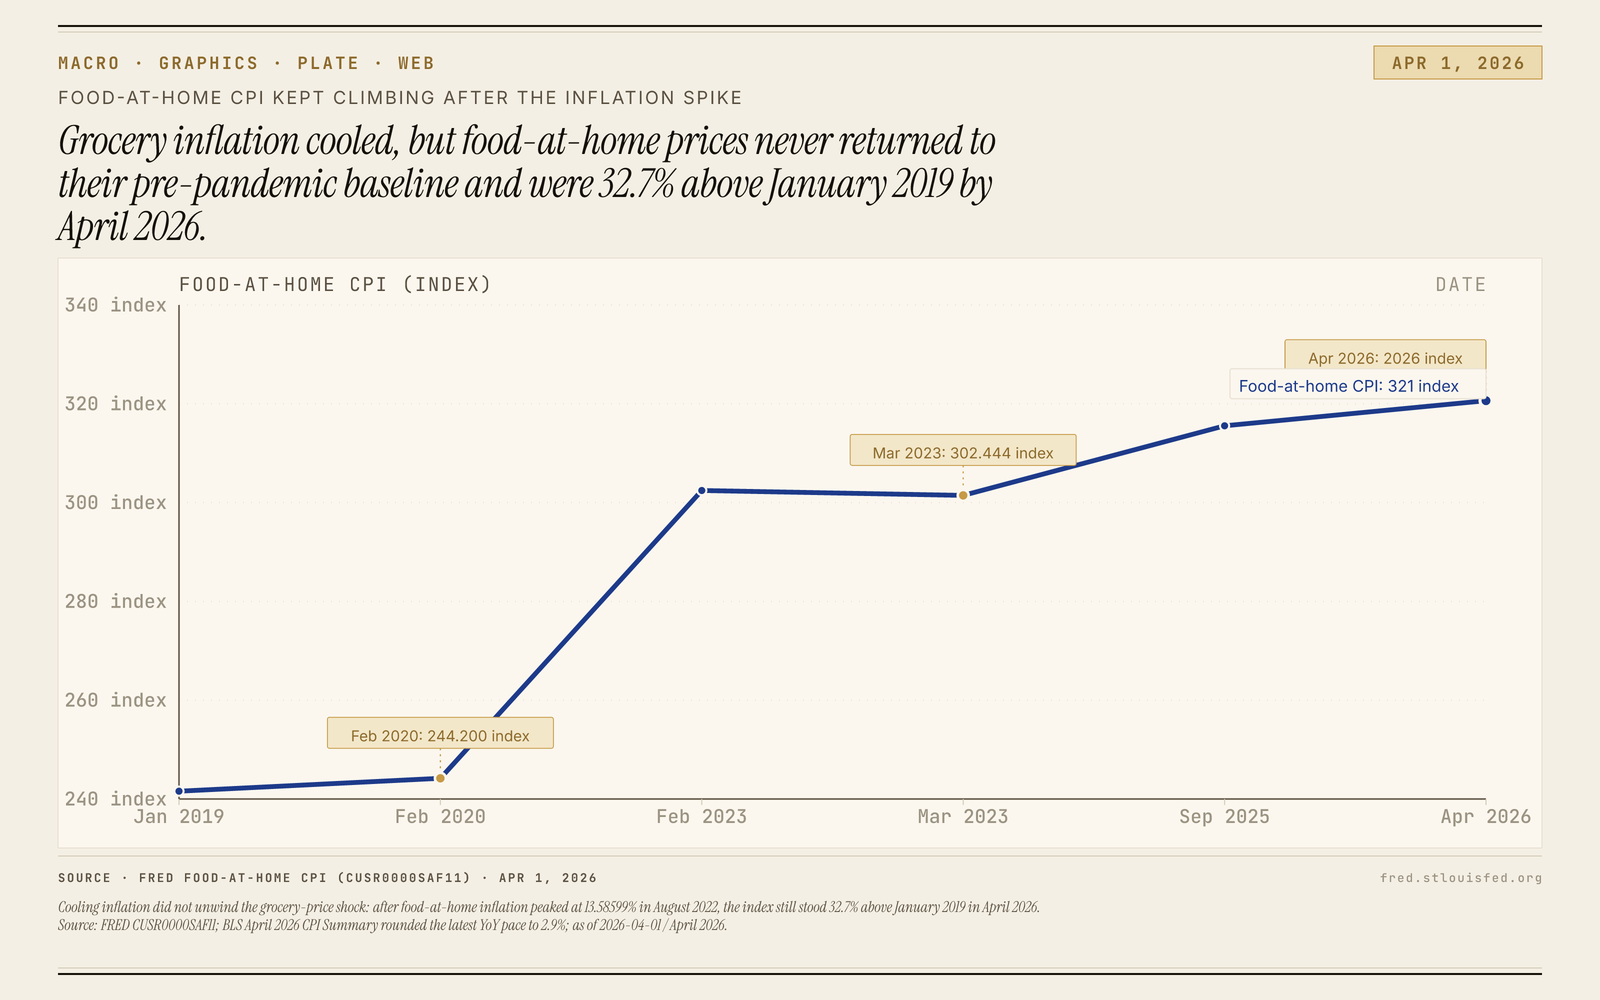 Plate 07
Grocery inflation cooled. Prices stayed high.
This chart shows grocery prices staying high even after inflation cooled: the food-at-home CPI rose from 244.200 before the pandemic to 320.633, and the brief dip from 302.444 to 301.467 did not last (fred.stlouisfed.org).
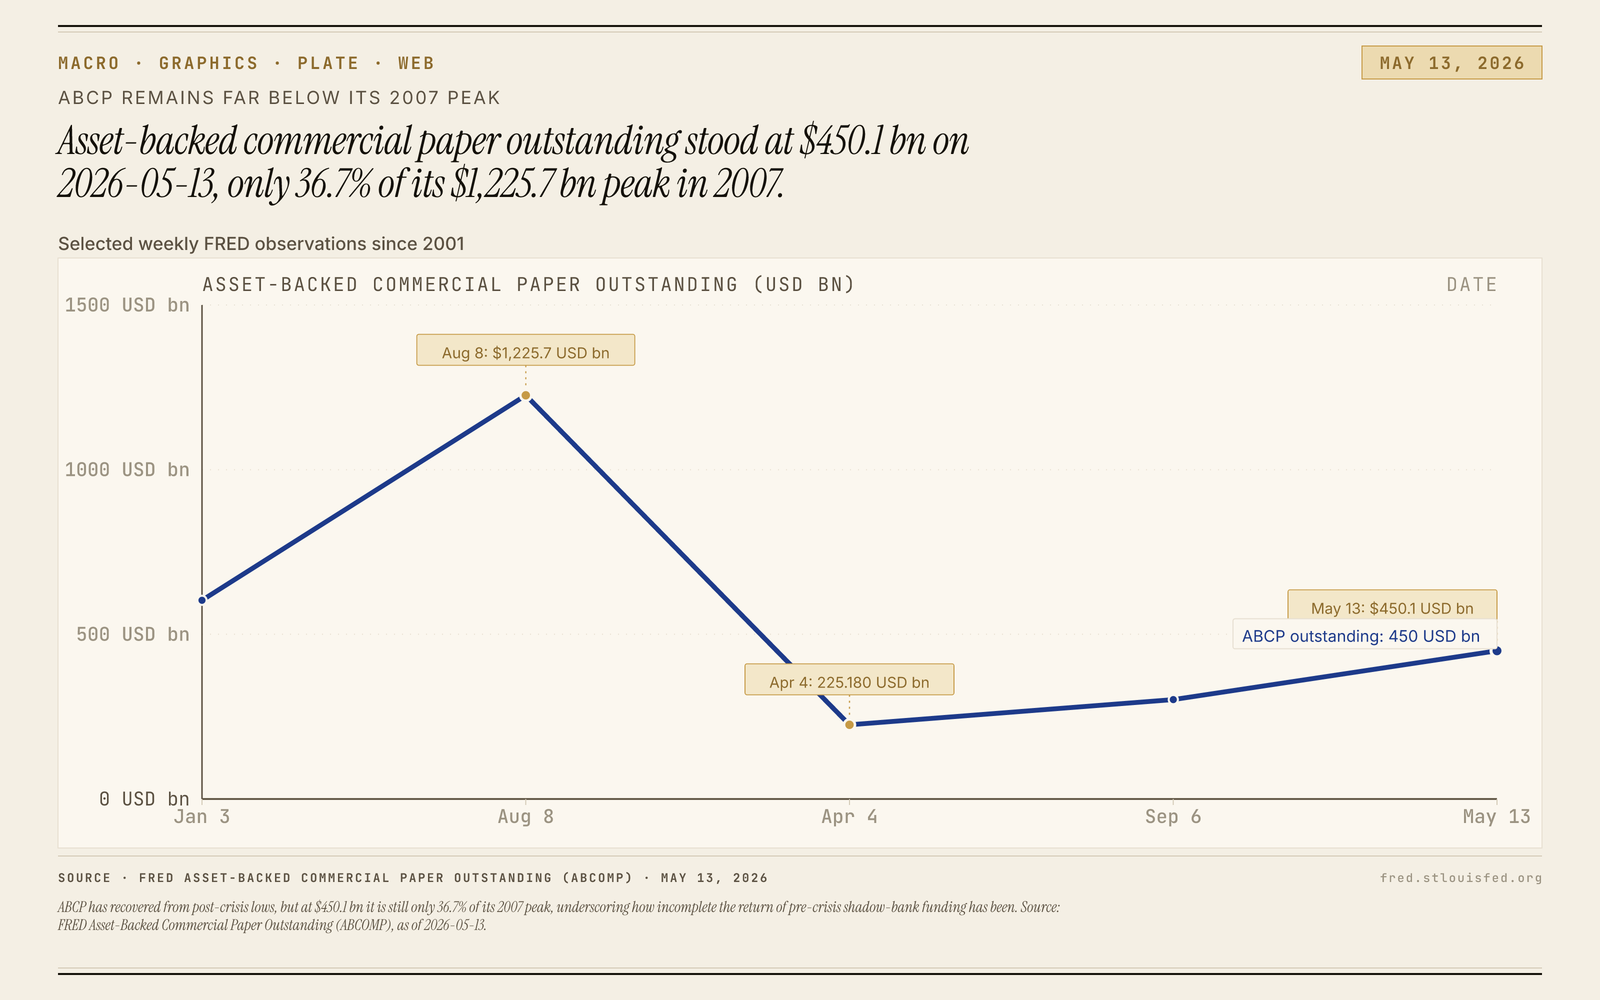 Plate 06
ABCP is still just 36.7% of peak
This chart shows asset-backed commercial paper outstanding at $450.1 bn, only 36.7% of its $1,225.7 bn peak, according to FRED’s Asset-Backed Commercial Paper Outstanding series (fred.stlouisfed.org).
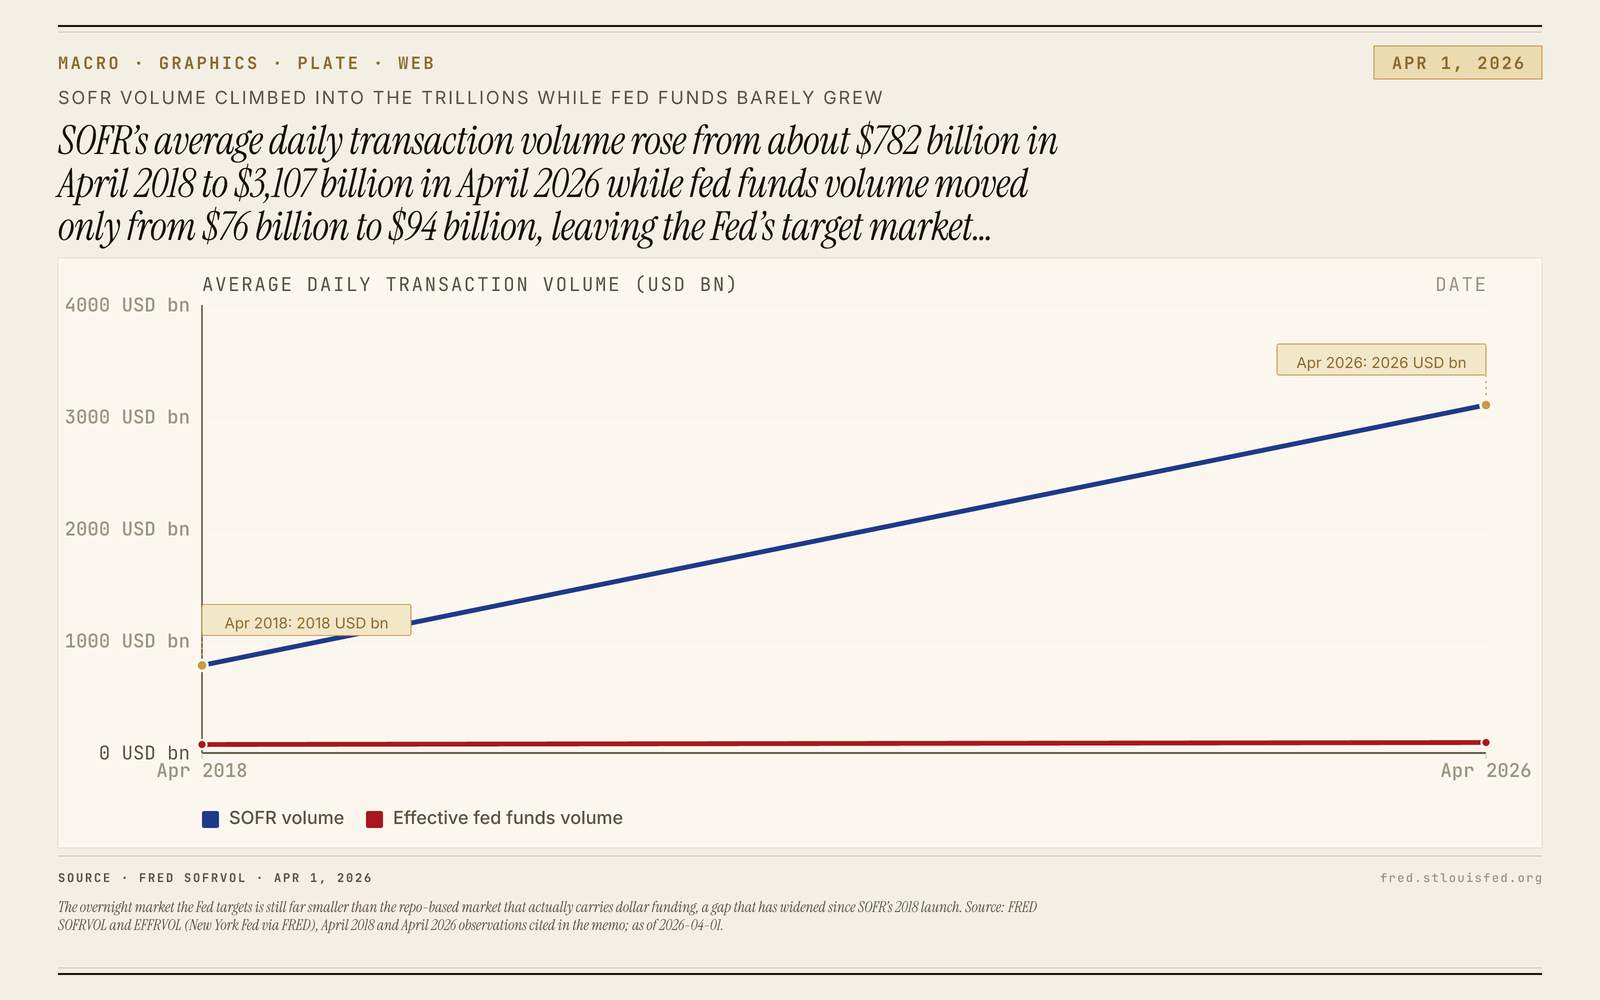 Plate 05
SOFR Volume Towers Over Fed Funds
The chart shows SOFR far above fed funds in average daily transaction volume, from $782 billion versus $76 billion at the chart’s opening April average to $3,107 billion versus $94 billion at its latest April average, using New York Fed data via FRED (fred.stlouisfed.org ; fred.stlouisfed.org).
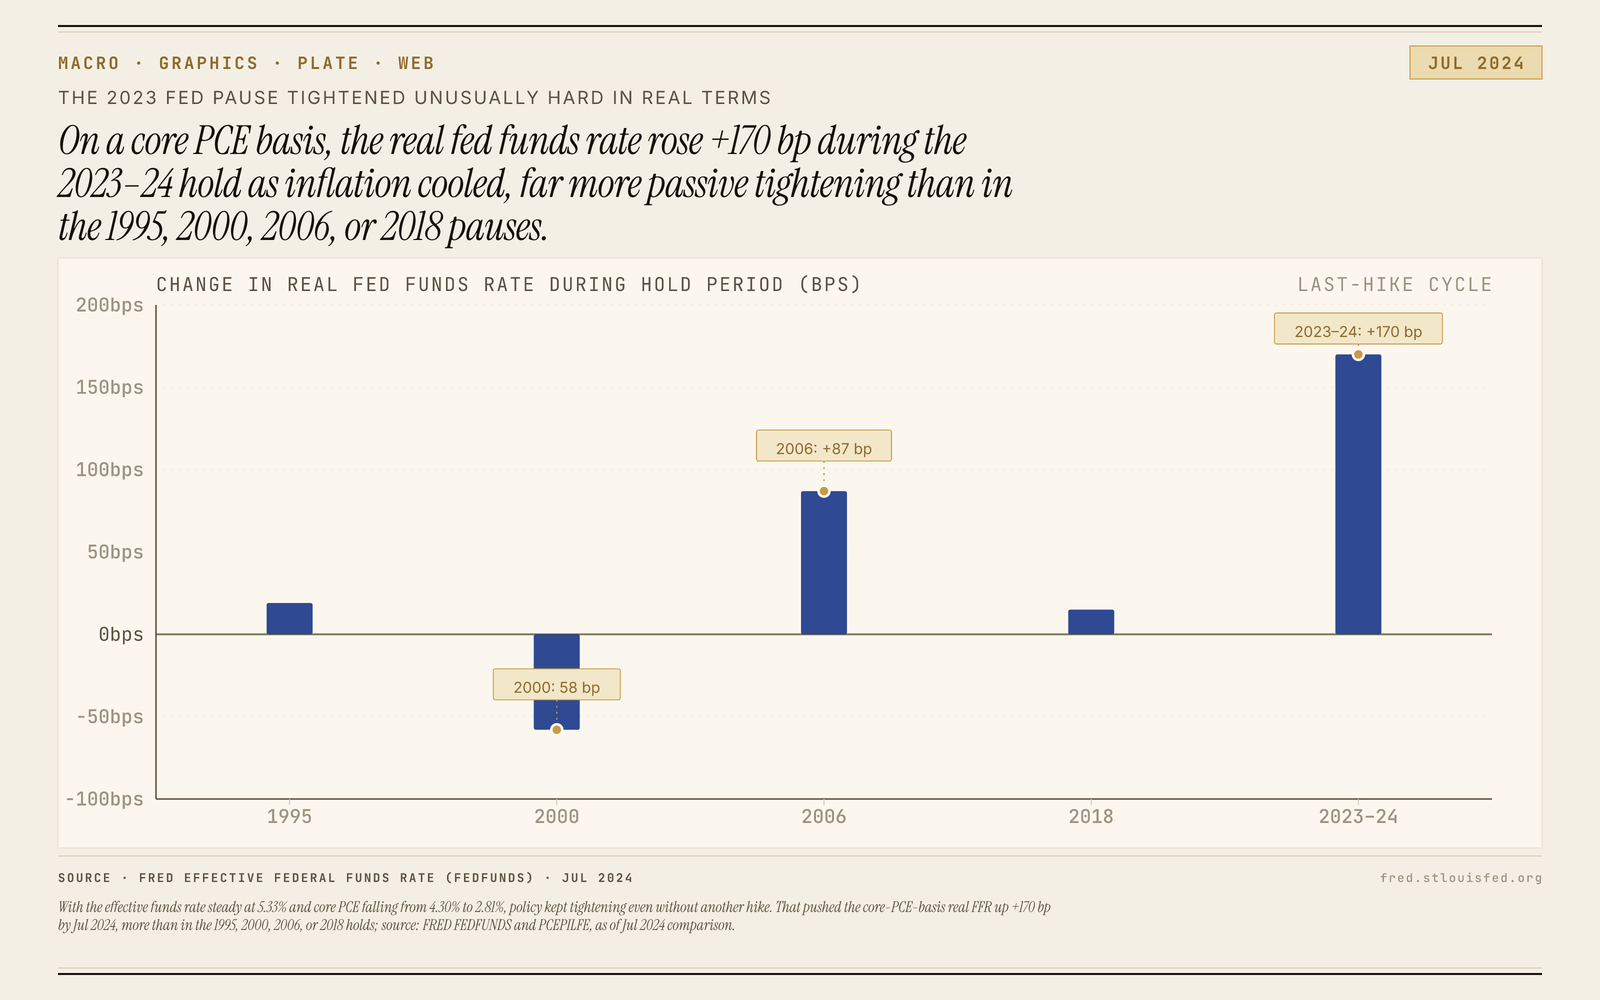 Plate 04
Fed pause kept tightening in real terms
The chart shows the real fed funds rate climbing during the latest hold as inflation cooled, with the effective rate at 5.33% and core PCE falling from 4.30% to 2.81%.
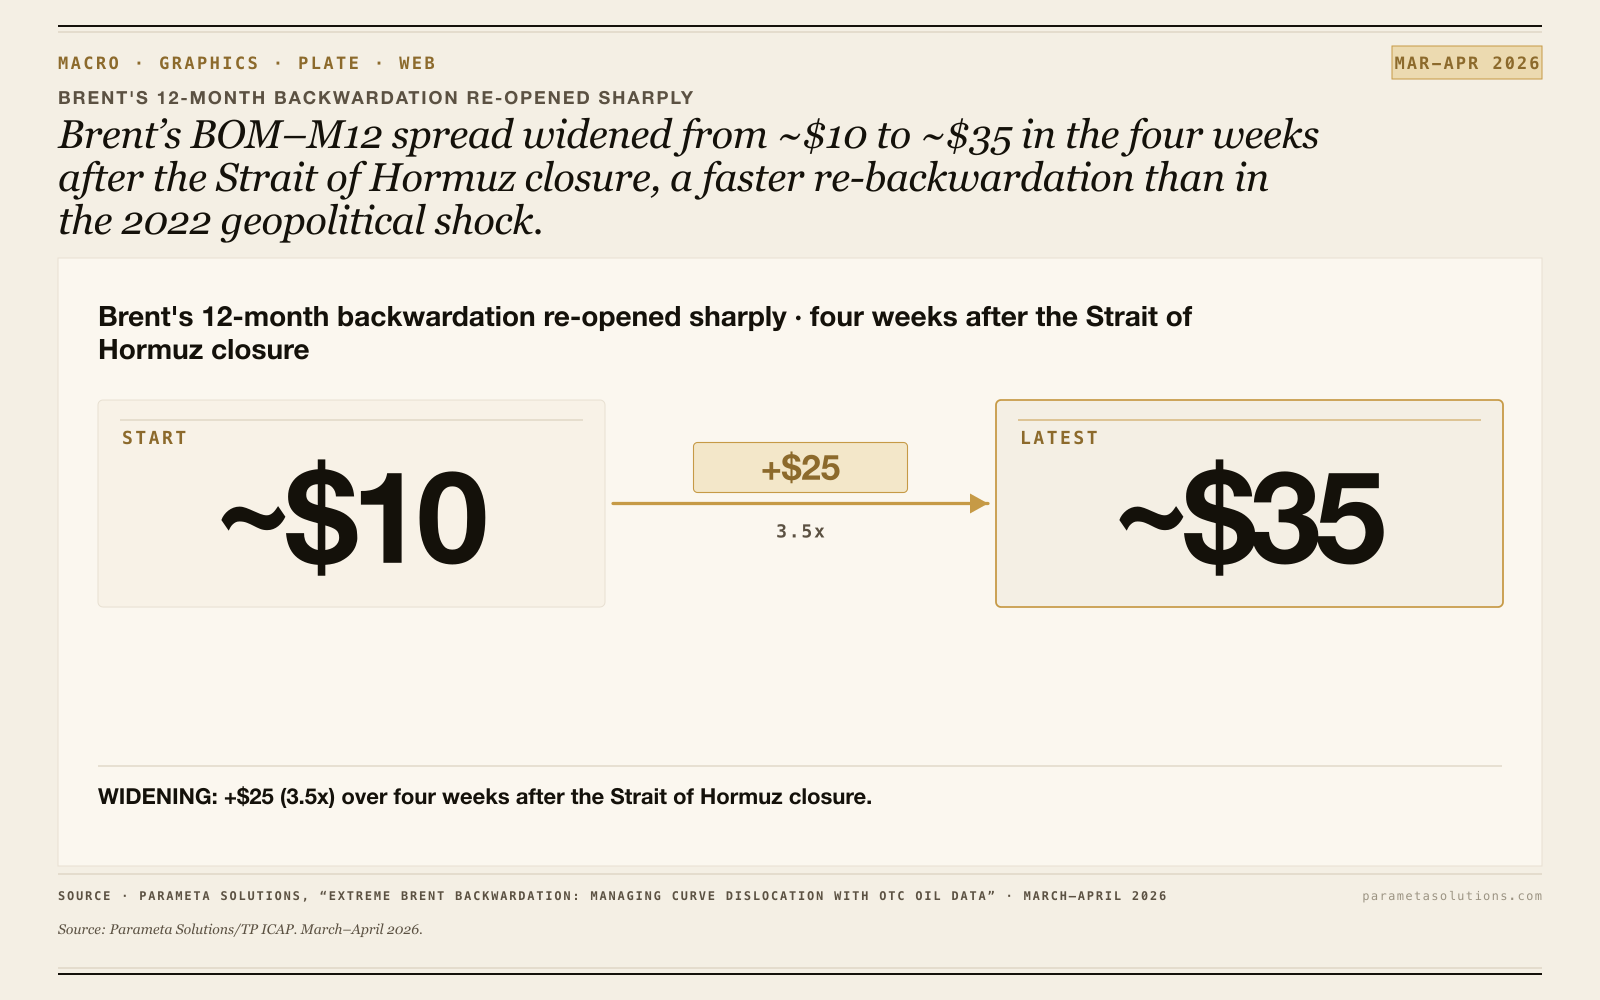 Plate 03
Brent Front-End Re-Steepened by Apr. 10
Parameta's public April 10 note shows Brent's BOM-M12 spread moving from about $10 in early March to about $35 by April 10.
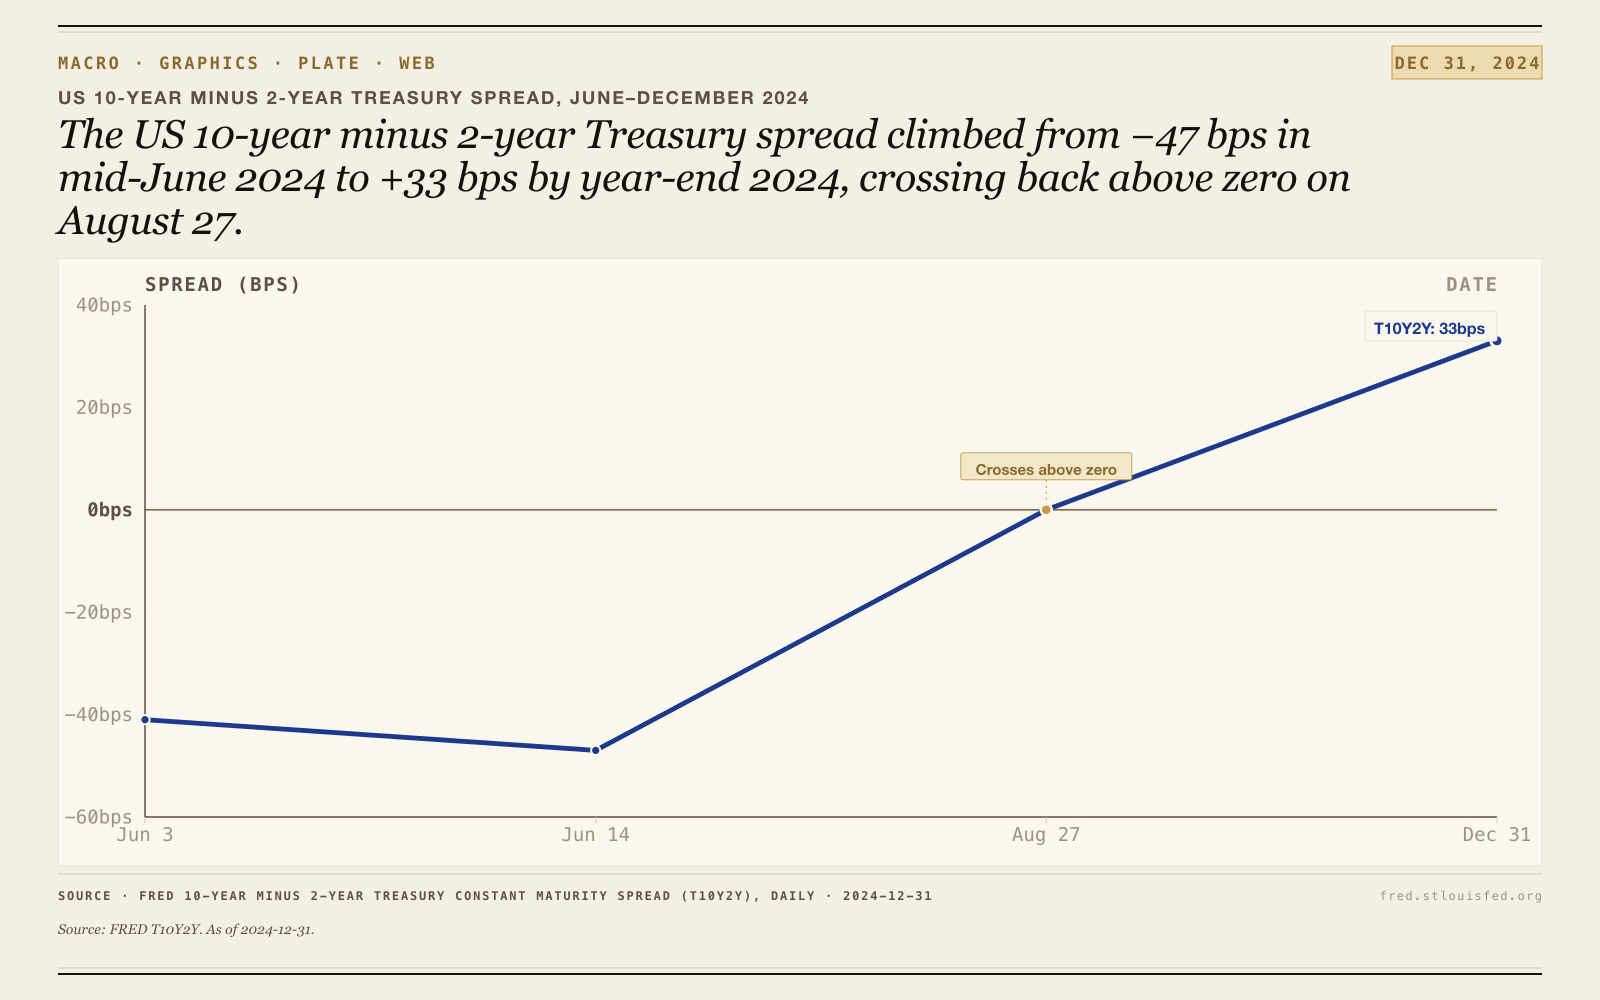 Plate 02
Treasury spread turns positive again
The spread moved from −47 bps on 2024-06-14 to 0.00 bps on 2024-08-27 and finished at +33 bps on 2024-12-31.
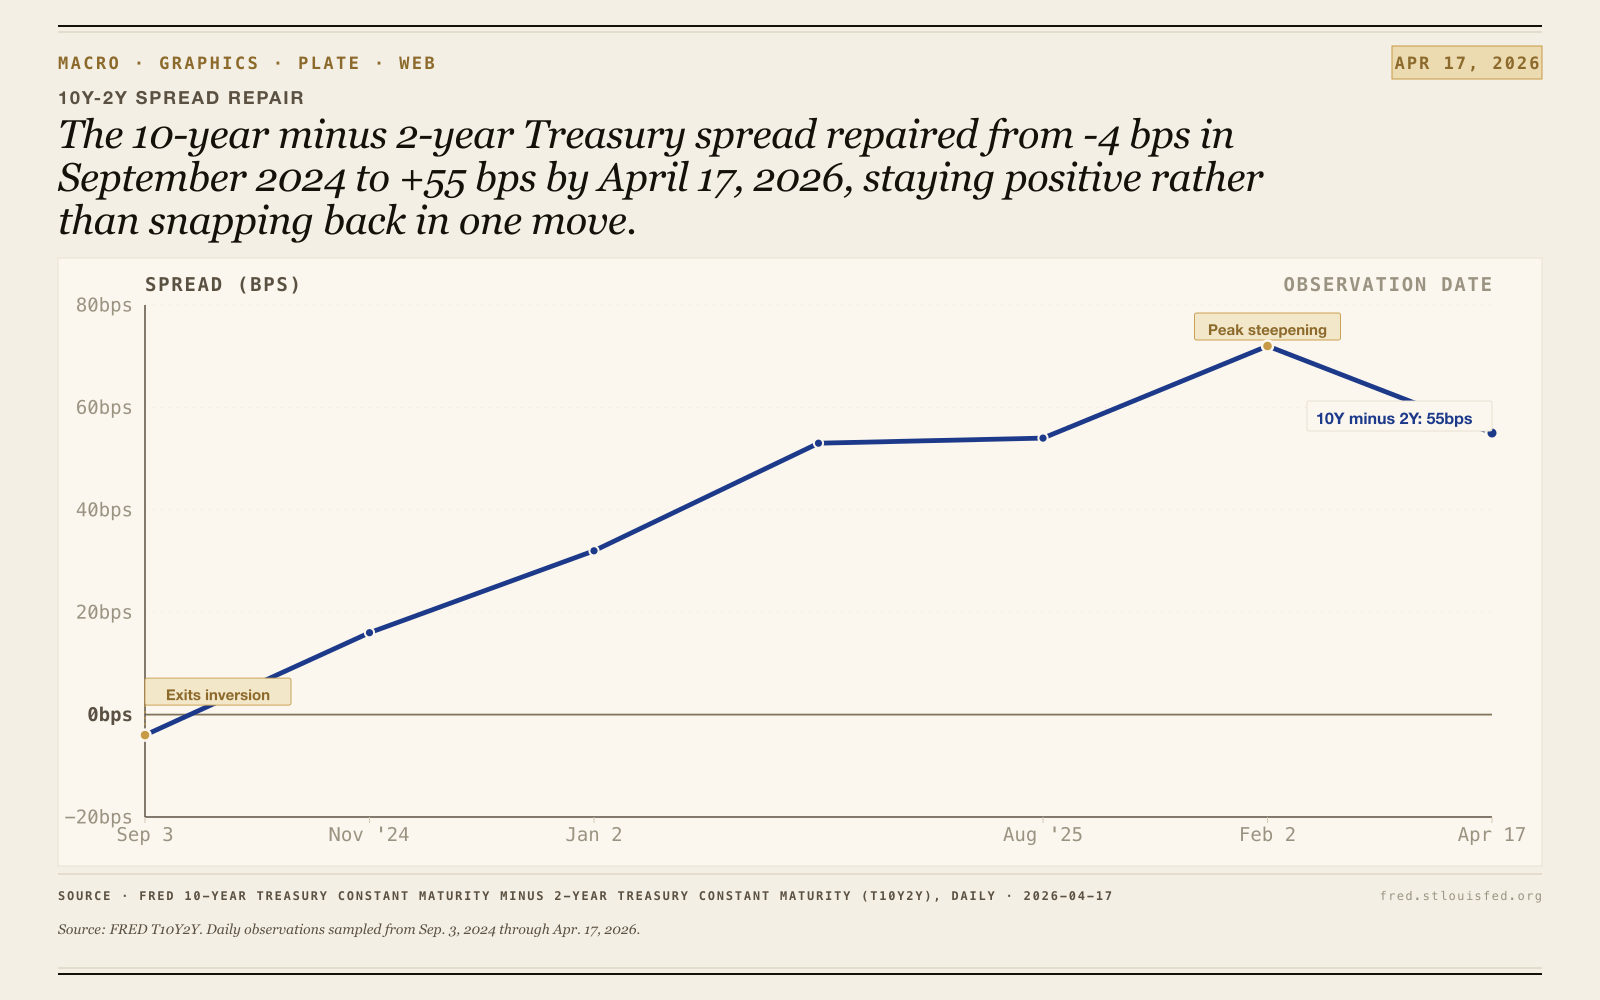 Plate 01
10-Year minus 2-Year spread climbs higher
The 10-Year minus 2-Year Treasury spread is climbing higher in recent months, and the chart reads less like a snapback than a patient repair.