Plate ·
SOFR Volume Towers Over Fed Funds

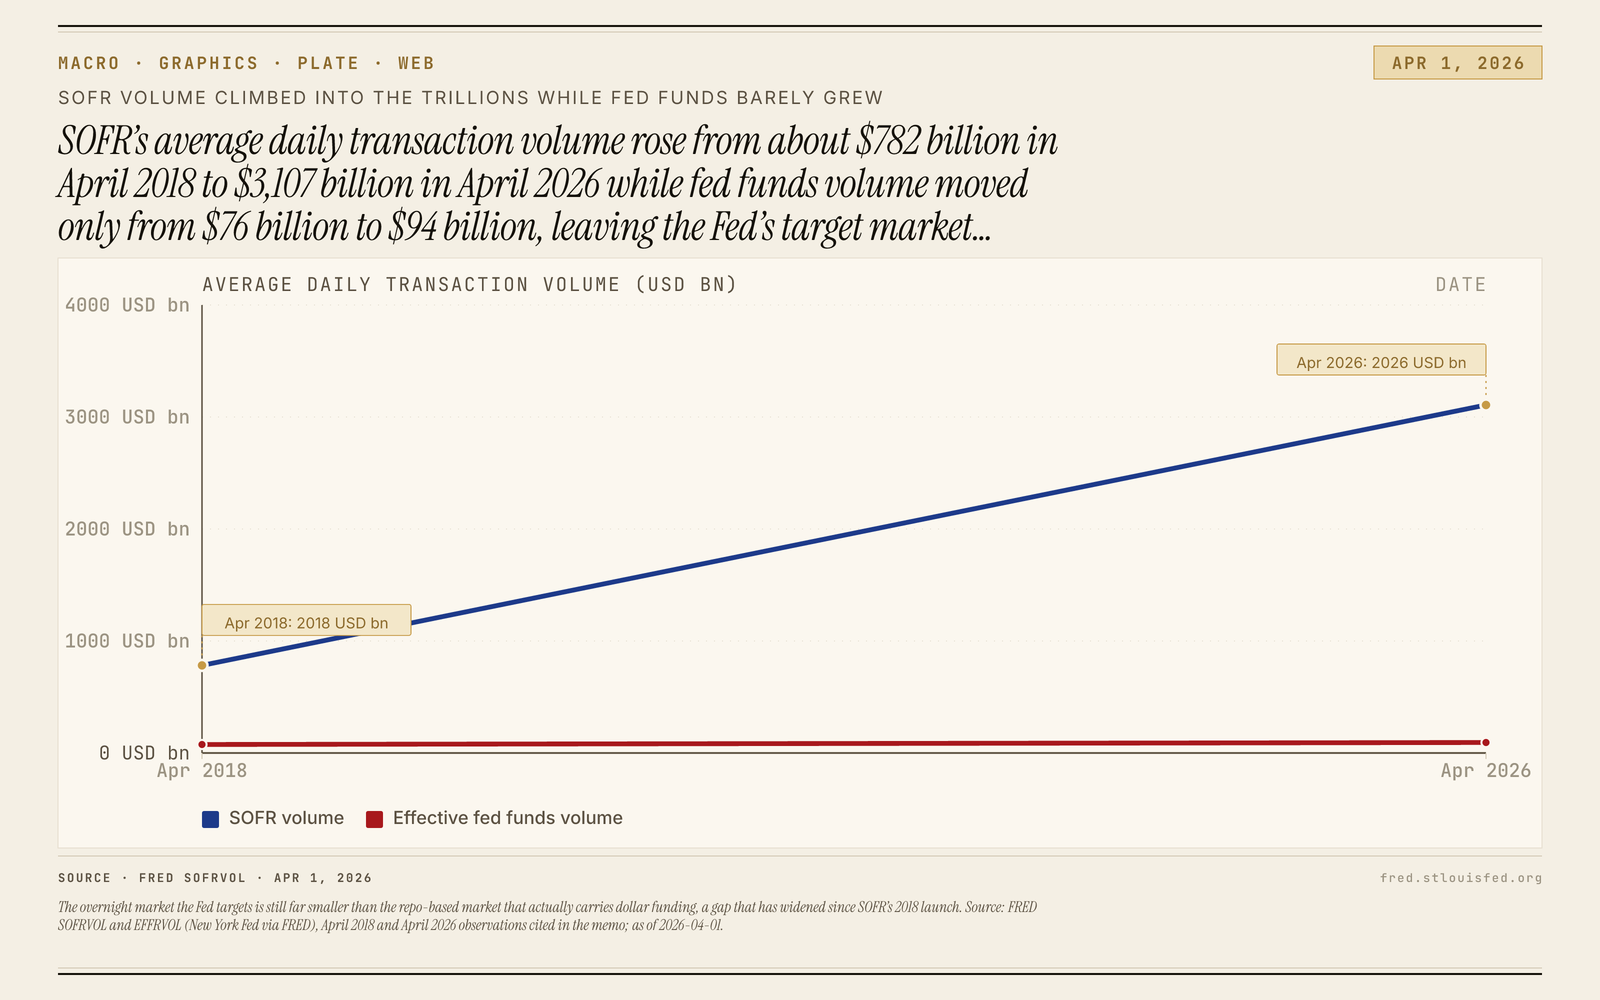
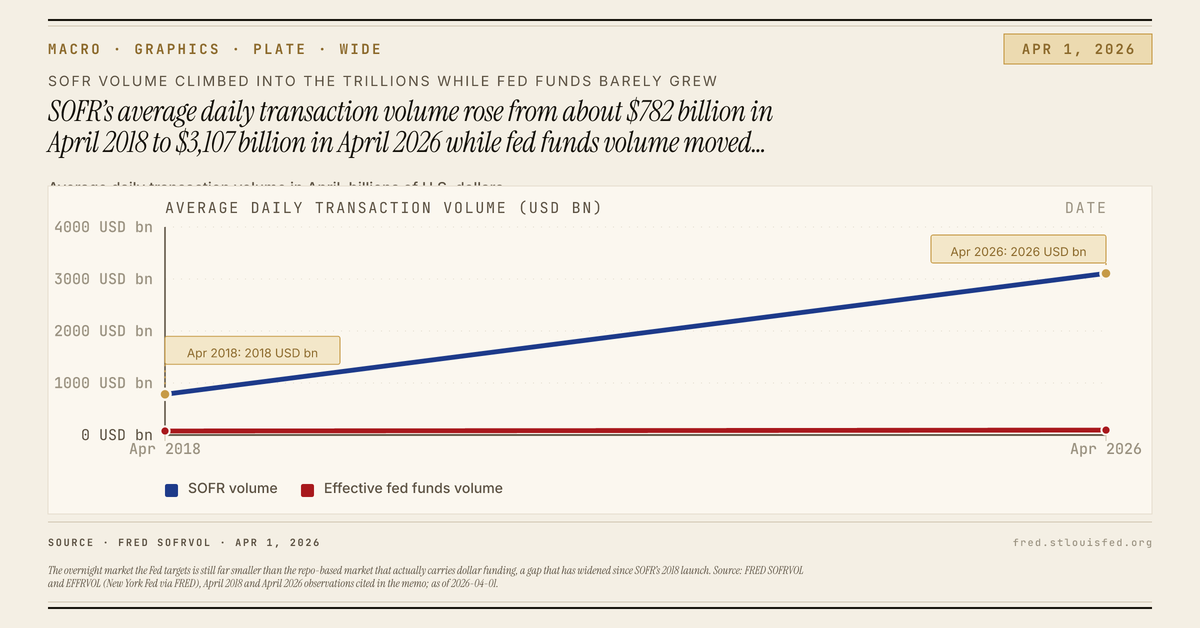
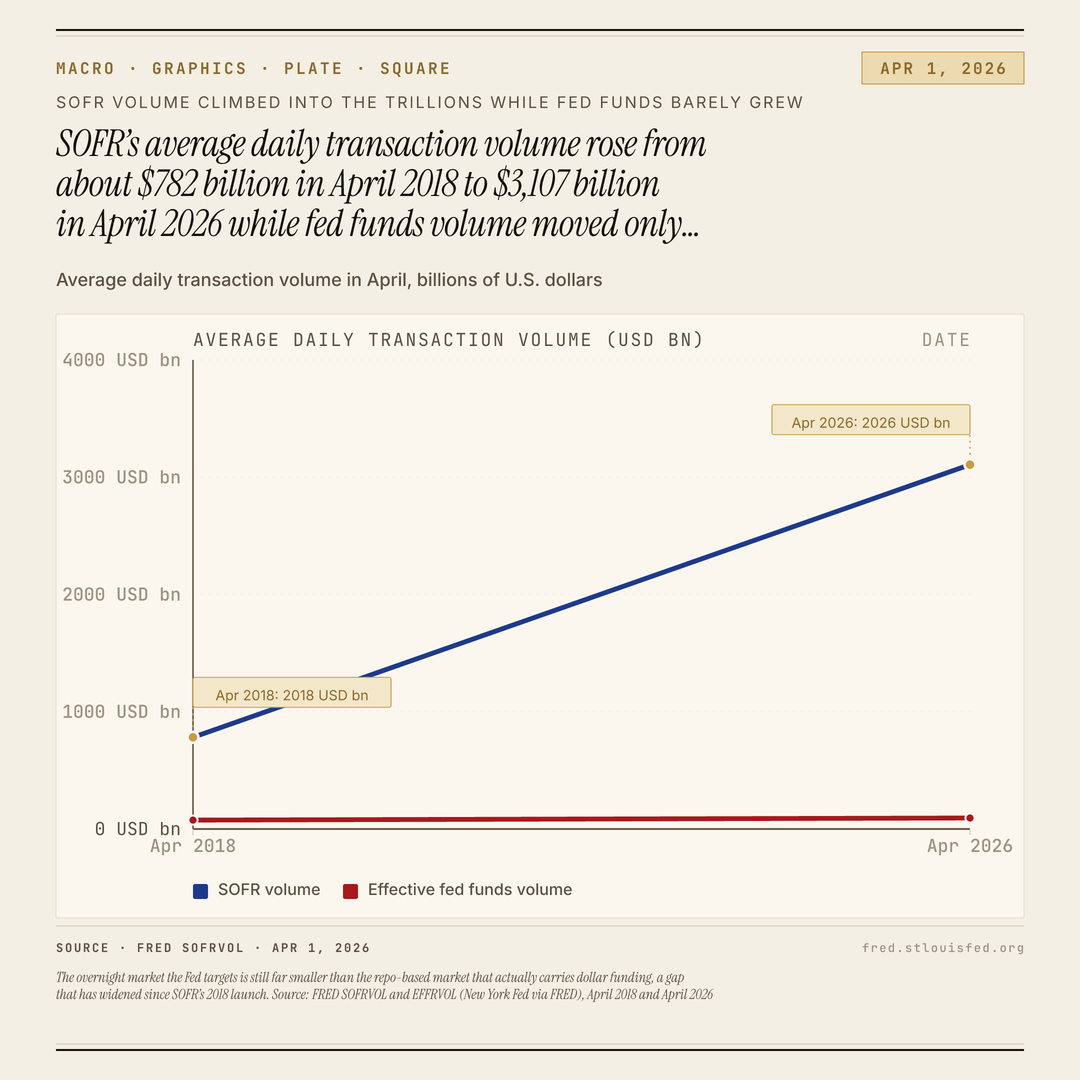
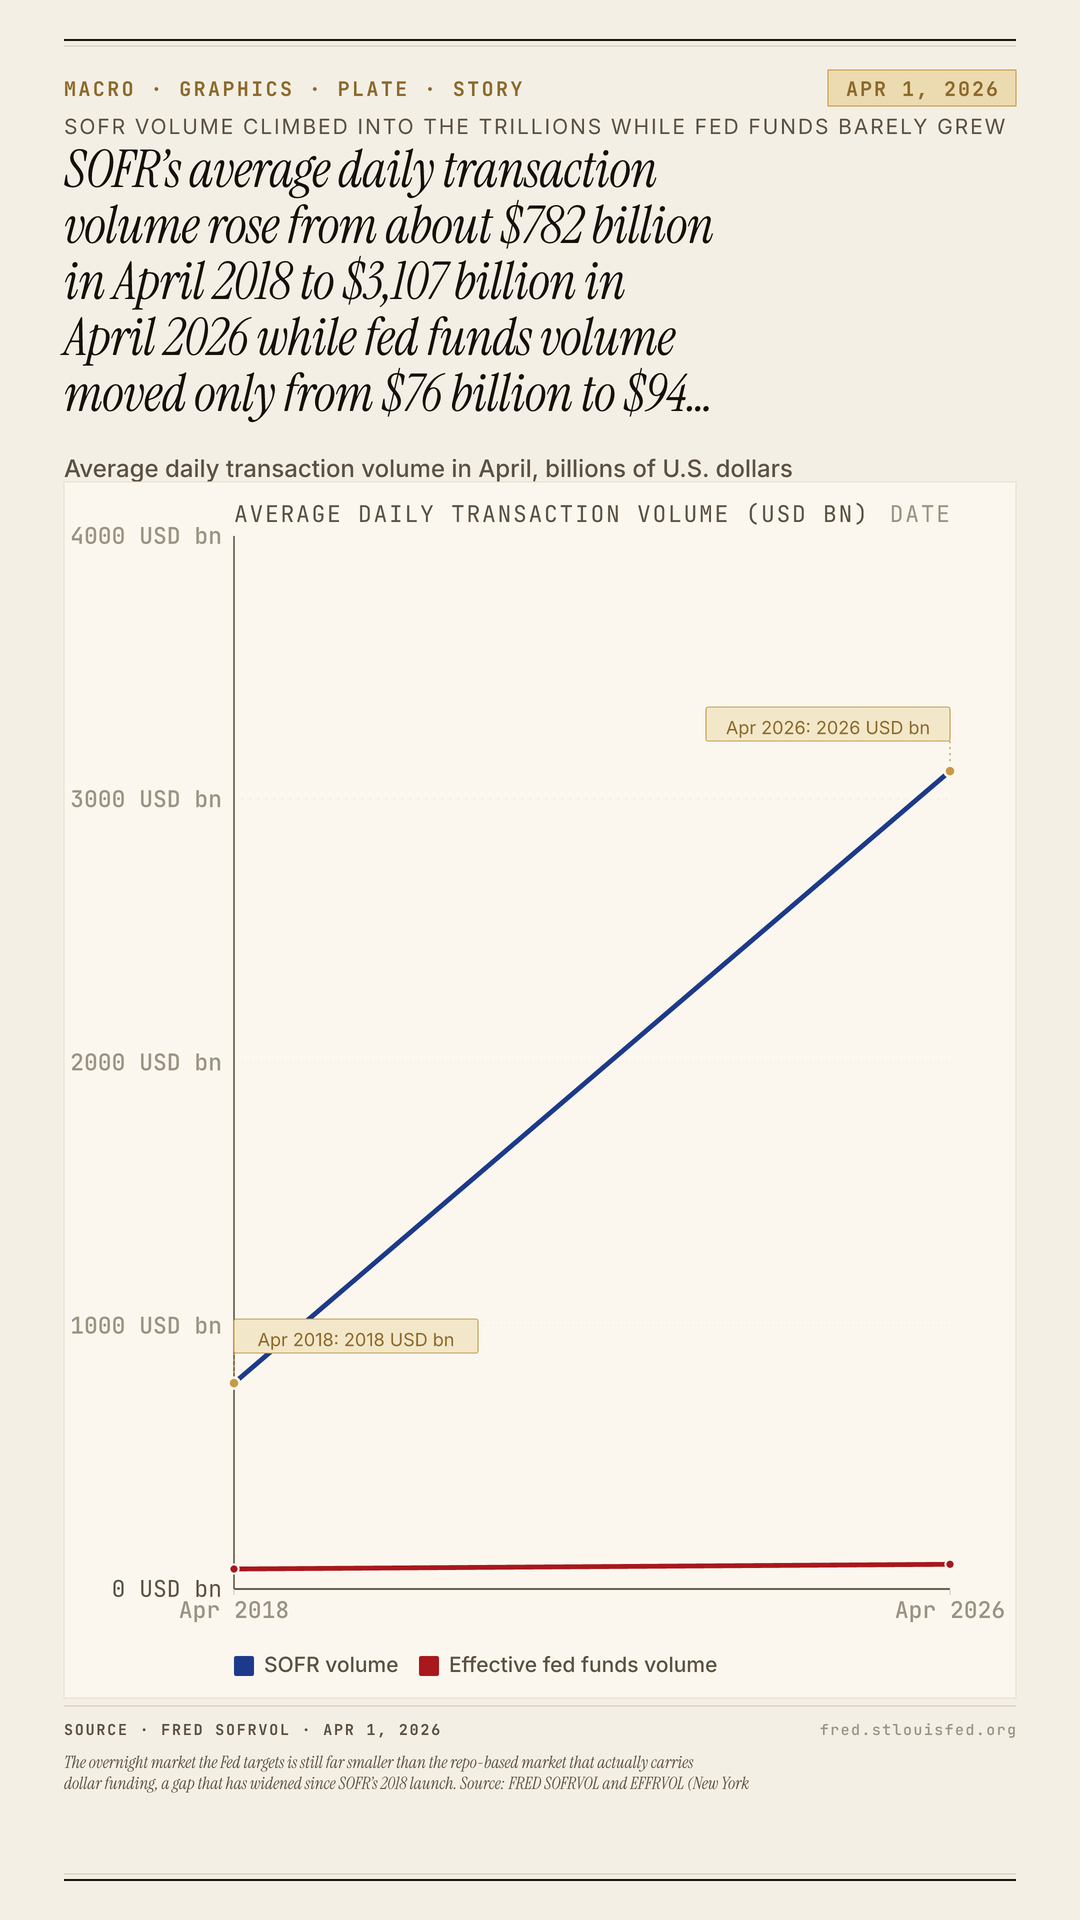
The overnight market the Fed targets is still far smaller than the repo-based market that actually carries dollar funding, a gap that has widened since SOFR’s 2018 launch. Source: FRED SOFRVOL and EFFRVOL (New York Fed via FRED), April 2018 and April 2026 observations cited in the memo; as of 2026-04-01.
Exports
Download plates
The chart shows SOFR far above fed funds in average daily transaction volume, from $782 billion versus $76 billion at the chart’s opening April average to $3,107 billion versus $94 billion at its latest April average, using New York Fed data via FREDfred.stlouisfed.org ; fred.stlouisfed.org).
That is the central comparison. The market behind SOFR is repo-based, and on this turnover measure it sits on a very different scale from the unsecured fed funds market the Fed still targets. One line rises into the trillions; the other remains in a much smaller range.
That matters because the benchmark market and the market carrying overnight dollar funding are no longer the same thing. Separate Dallas Fed commentary describes the broader overnight repo market at more than $4.5 trillion and fed funds at a bit over $100 billion, a broader comparison that points in the same direction. On volume, the center of gravity sits in repo, not fed funds.