Plate ·
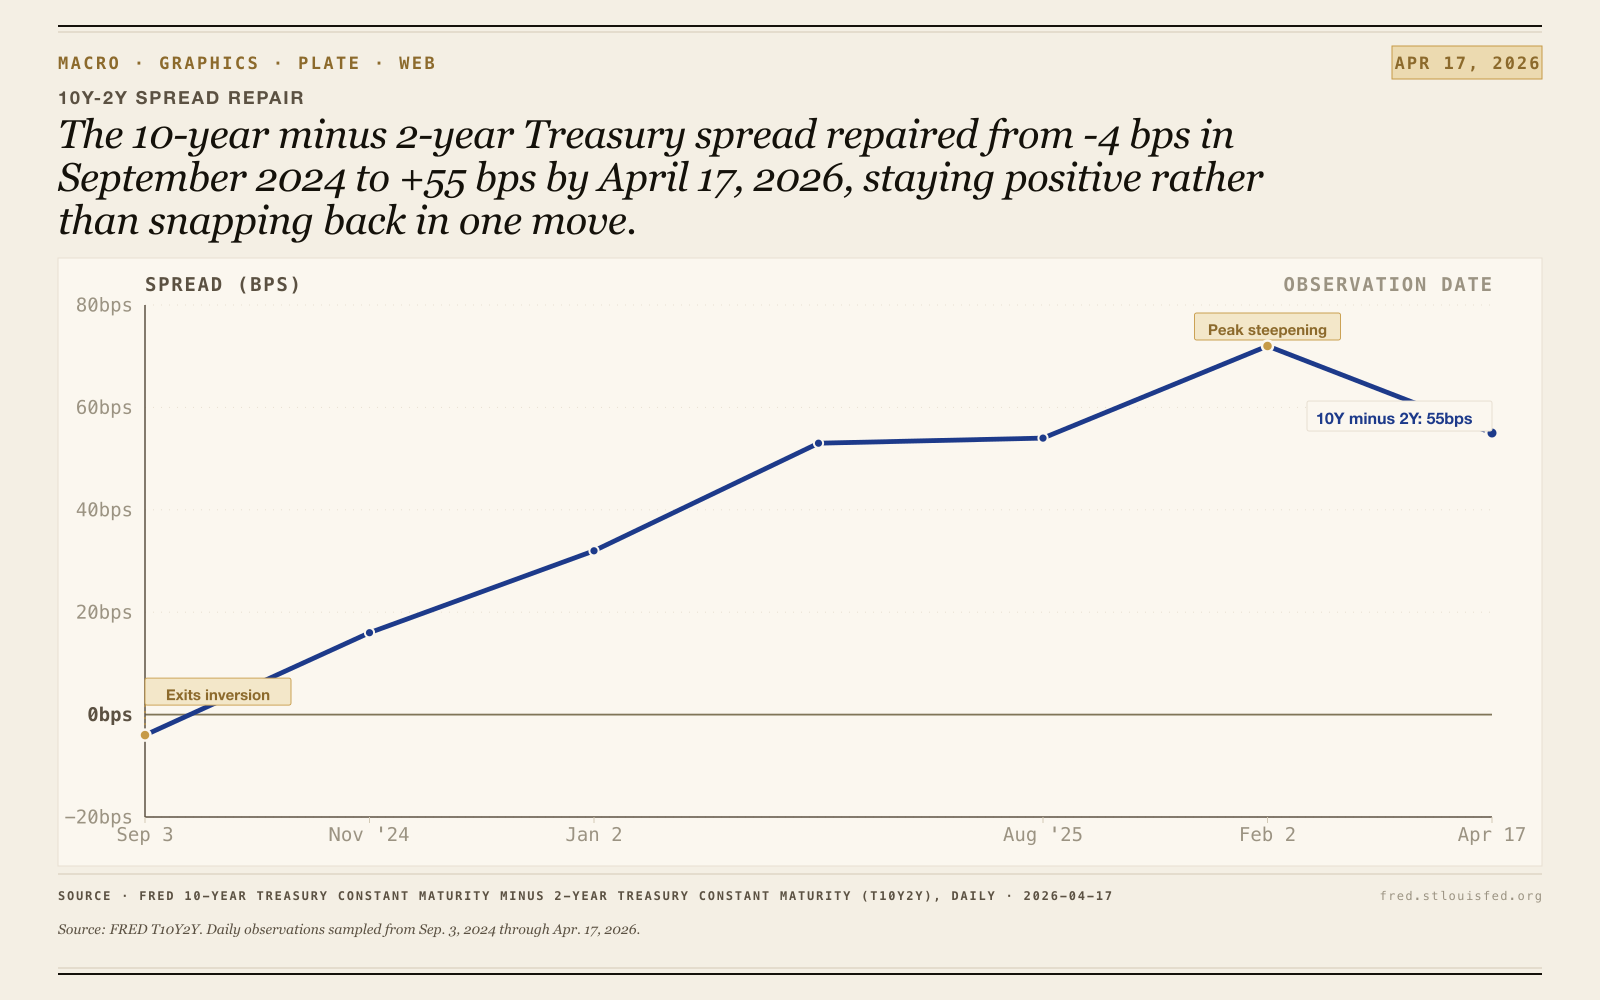
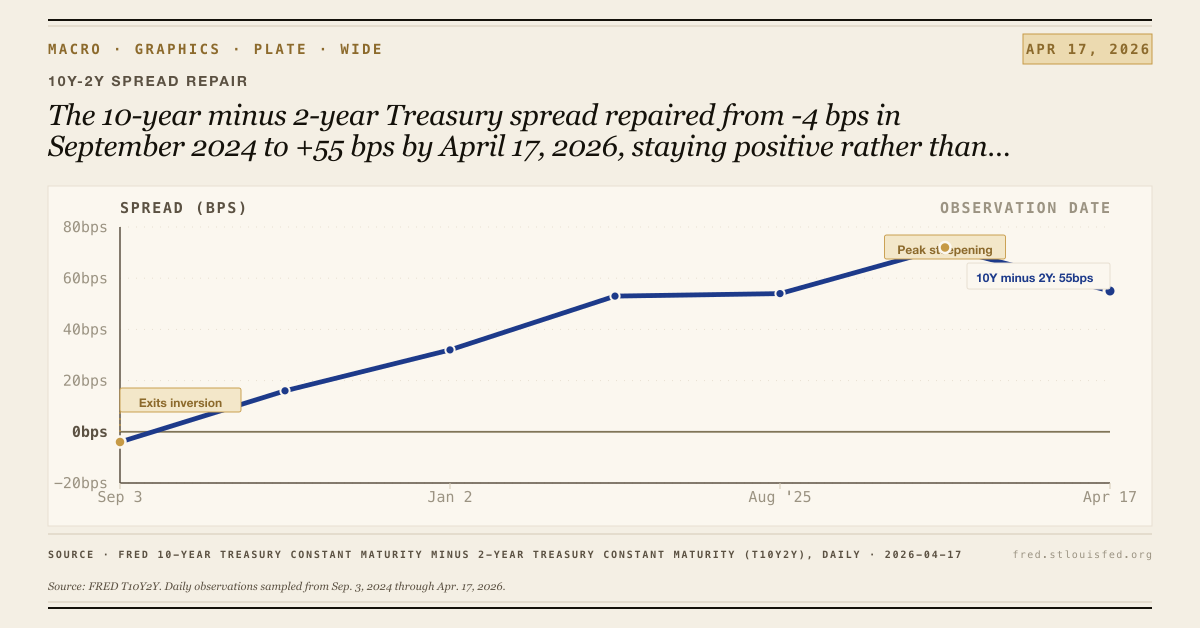
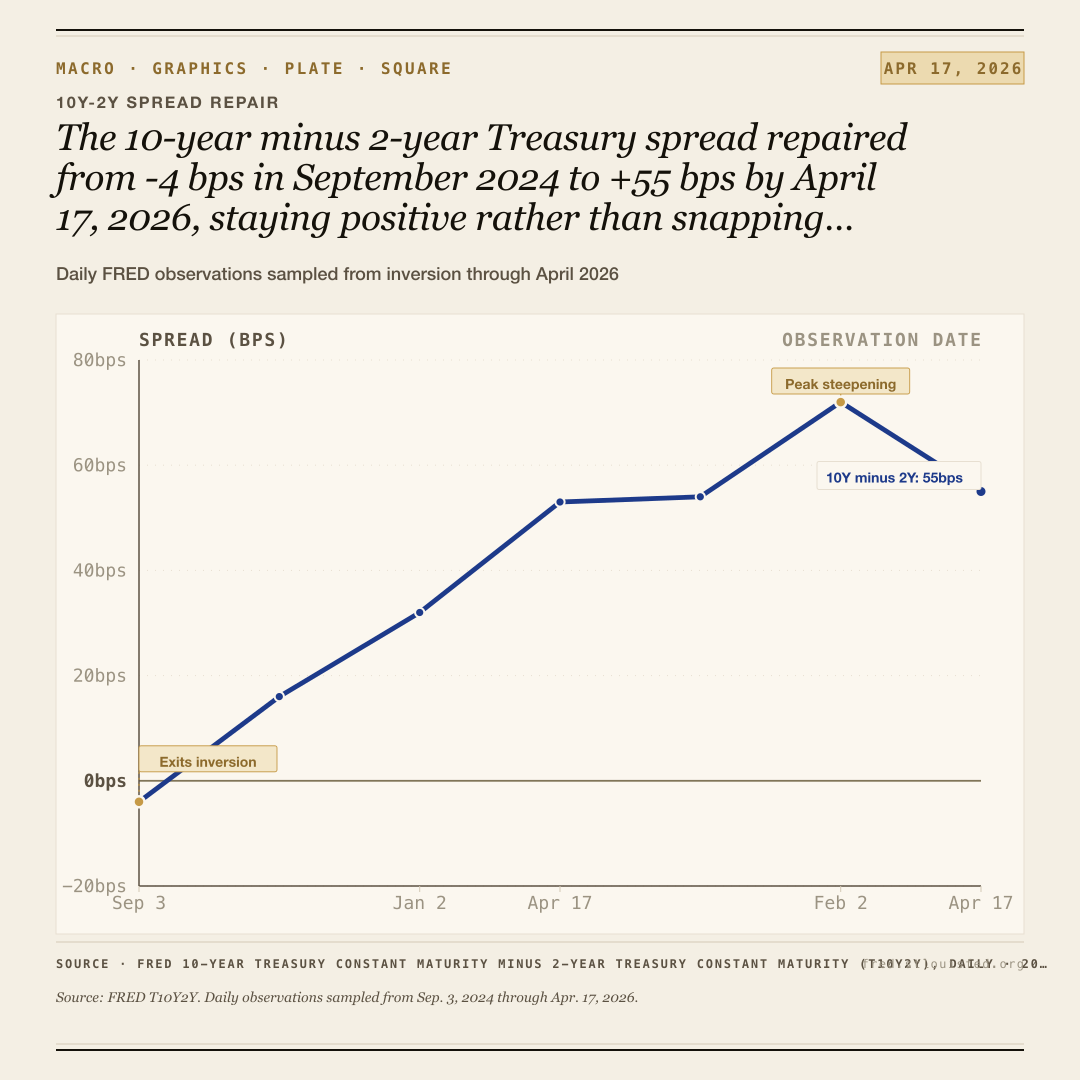
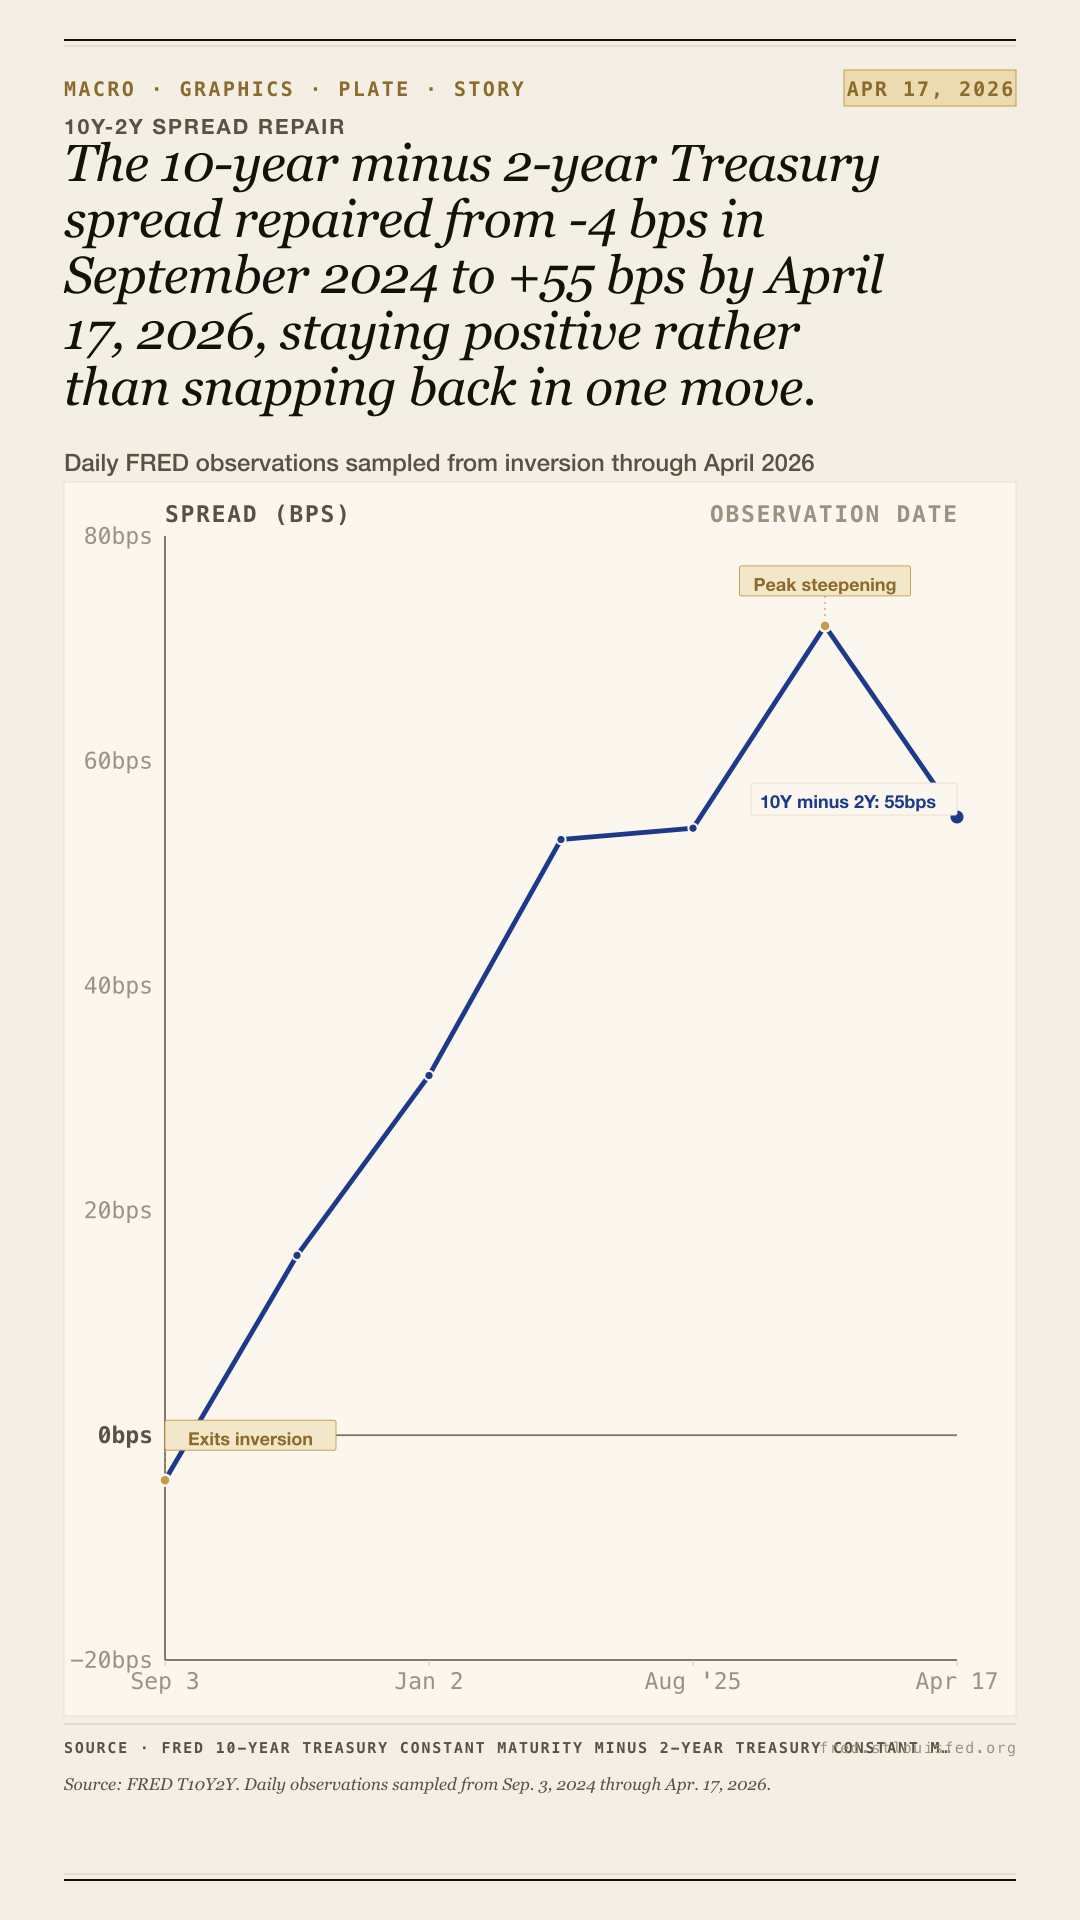
10-Year minus 2-Year spread climbs higher

Source: FRED T10Y2Y. Daily observations sampled from Sep. 3, 2024 through Apr. 17, 2026.
Exports
Download plates
The 10-Year minus 2-Year Treasury spread is climbing higher in recent months, and the chart reads less like a snapback than a patient repair.
This chart tracks the 10-Year minus 2-Year Treasury Constant Maturity series (T10Y2Y), the canonical curve-shape gauge from FRED: fred.stlouisfed.org After a long spell in inversion, the spread has been grinding higher in recent months. The lift did not happen all at once. A sharp re-steepening came after a cooler-than-expected jobs print last autumn; a quieter drift followed as the front end softened through spring. That pattern matters more than any single day’s move. It says the market has not snapped back to a clean, healthy slope, but it has stopped treating inversion as fixed state. The curve is leaning less against growth than it was, and the climb has been slow enough to look persistent rather than reflexive. On the page, the line should read as patient repair, not a dramatic turn, with the recovery in slope doing the talking. That makes the chart useful: it captures the mood shift without pretending the curve has finished its work. Source and download: FRED series page above.