Plate ·
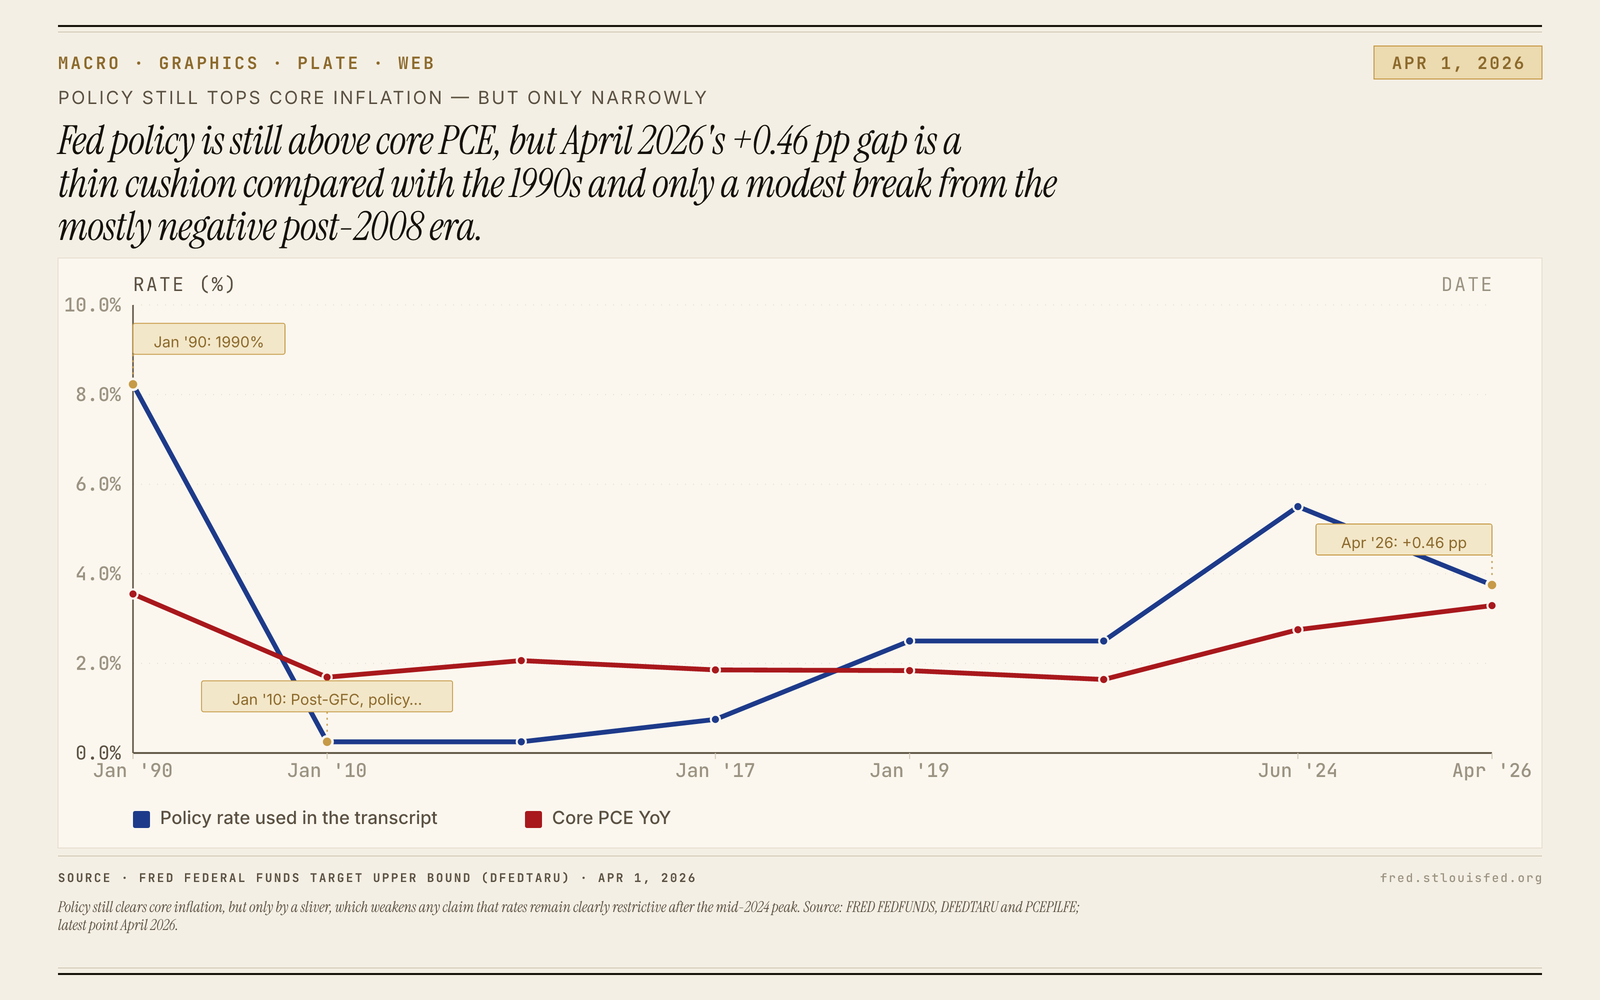
Policy Rate Barely Tops Core PCE

Policy still clears core inflation, but only by a sliver, which weakens any claim that rates remain clearly restrictive after the mid-2024 peak. Source: FRED FEDFUNDS, DFEDTARU and PCEPILFE; latest point April 2026.
Exports
Download plates
The chart shows the policy rate still above core PCE by +0.46 pp. That is a real break from the mostly negative post-crisis era, but it is thin next to the earlier pre-crisis pattern and the recent +2.75 pp peak.
The chart shows the policy rate still above core PCE, with the latest point at 3.75% versus 3.28919% — a +0.46 pp gap (FRED: fred.stlouisfed.org).
That keeps policy on the restrictive side of core inflation, but only barely. The cushion was +2.75 pp at the tightening peak, so the current margin is much slimmer even though rates still clear core PCE.
The historical contrast is the point. At the left edge of the chart, policy is 8.23% while core PCE is 3.55018%, and the broader pre-crisis pattern often ran +2 to +4 pp above core inflation. The post-crisis era was mostly the opposite, averaging -1.2 pp, which makes today’s positive spread notable for that regime.
So this is a narrow claim, not a sweeping one: policy is still above core inflation, and that kind of margin barely existed through most of the post-crisis years. But the latest reading looks closer to the brief +0.56 pp late-cycle patch than to a comfortably restrictive buffer.