Plate ·
Real Brent Below Prior Oil Shock Peaks
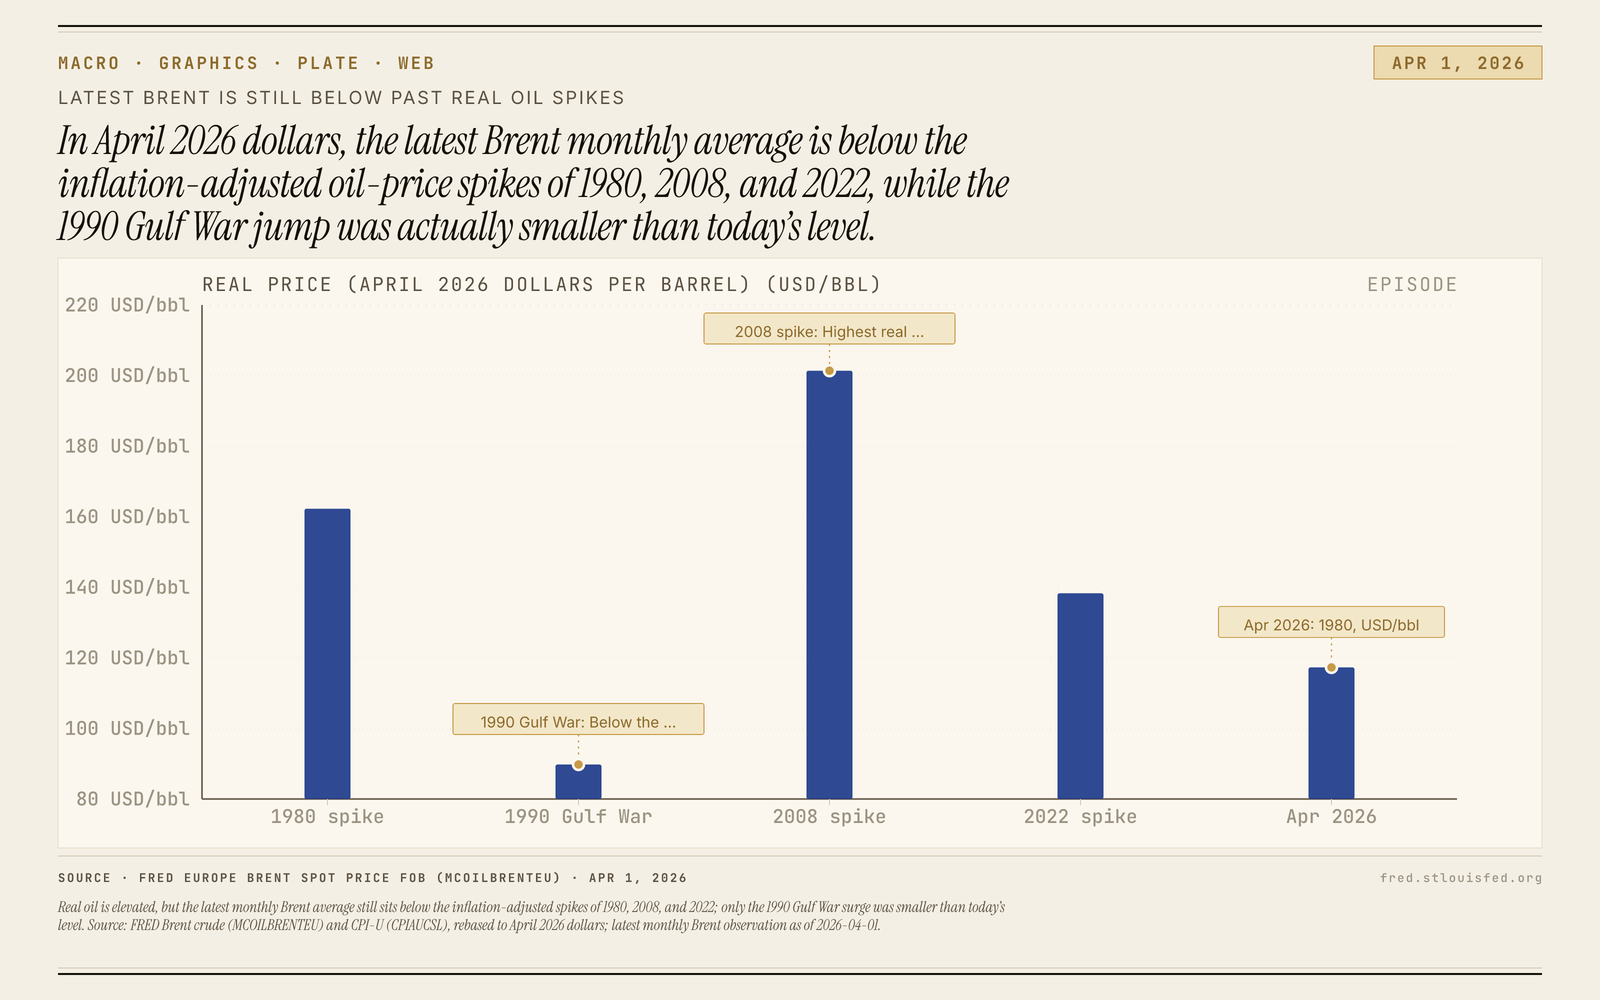
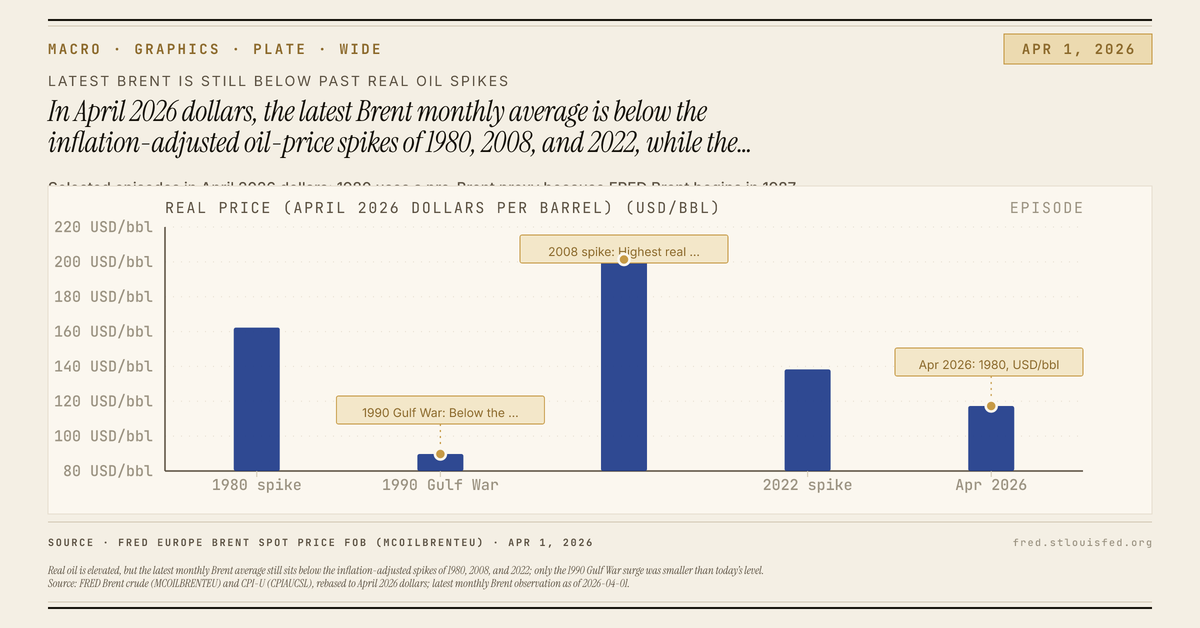
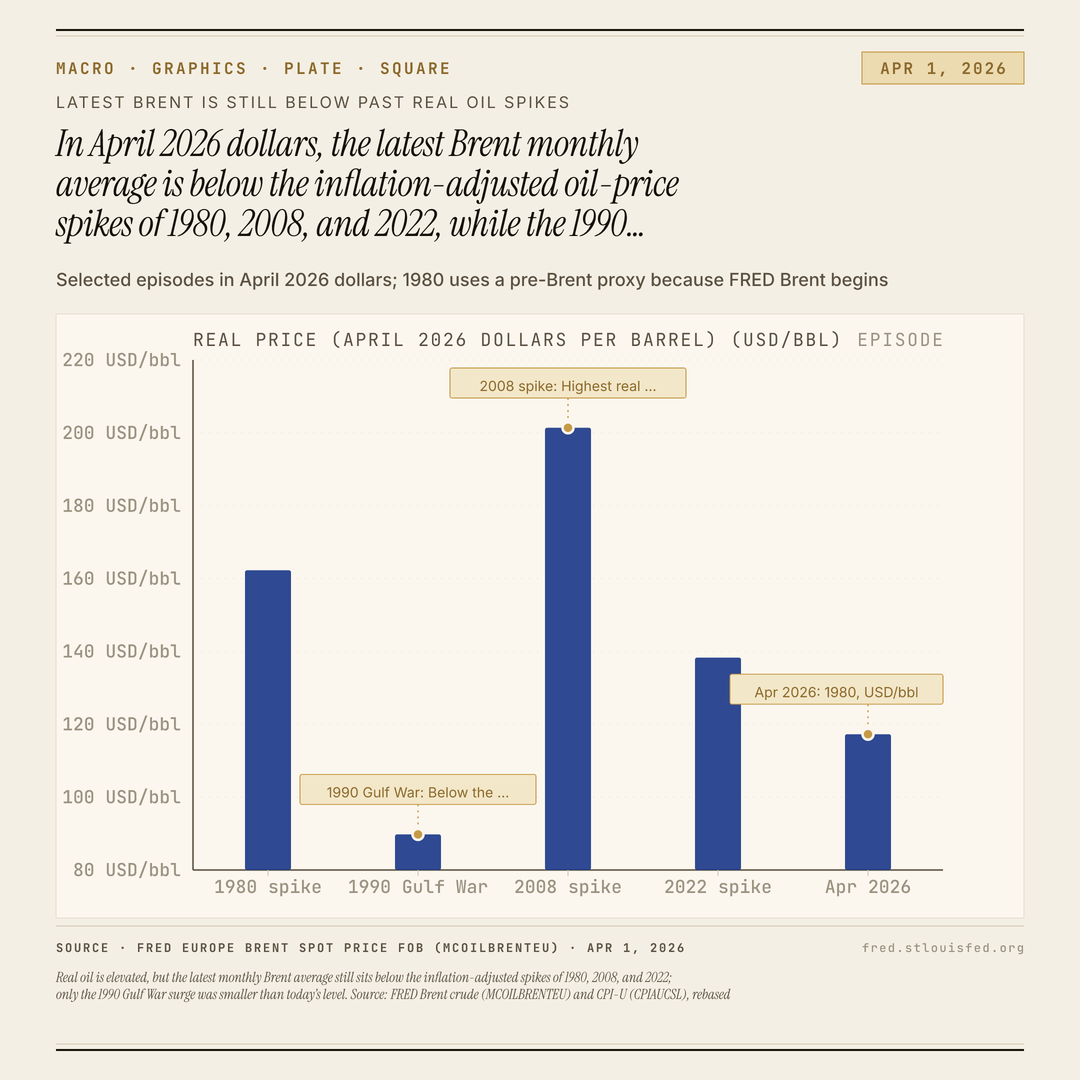
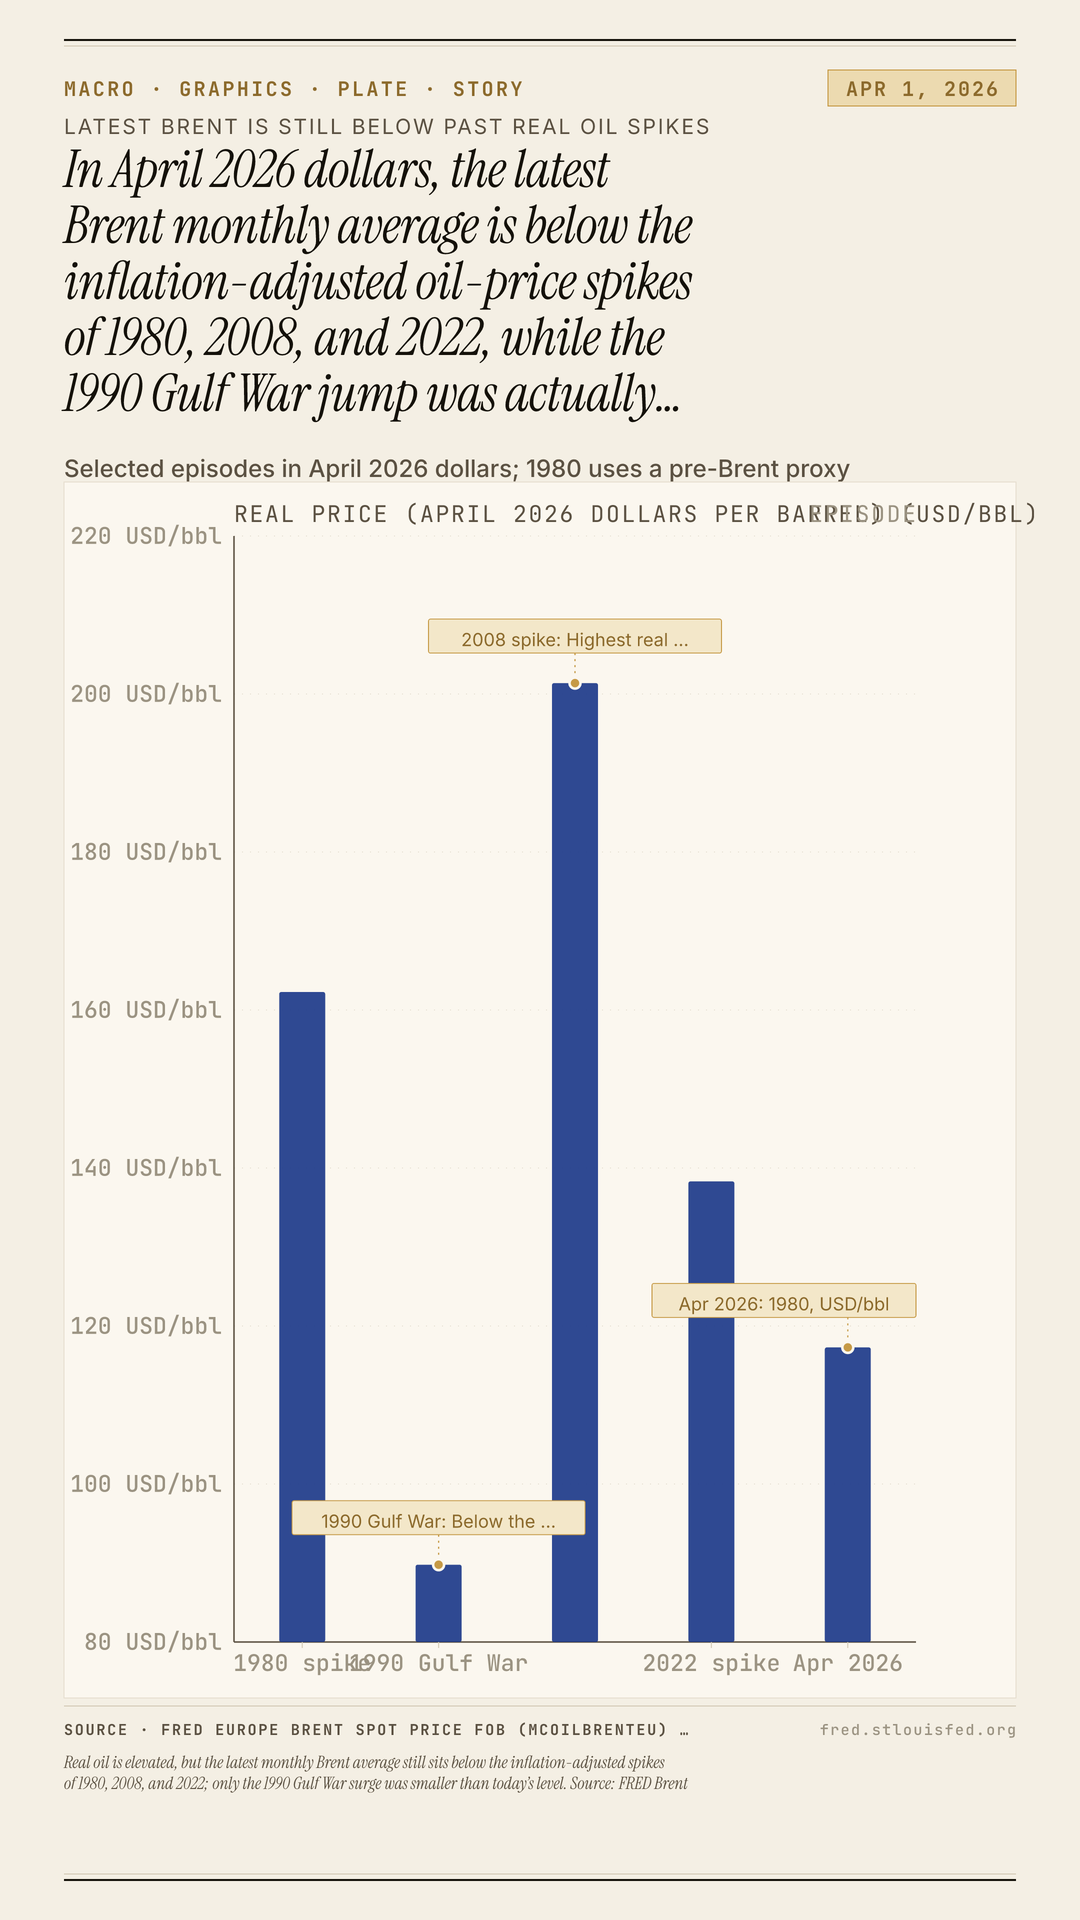
Real oil is elevated, but the latest monthly Brent average still sits below the inflation-adjusted spikes of 1980, 2008, and 2022; only the 1990 Gulf War surge was smaller than today’s level. Source: FRED Brent crude (MCOILBRENTEU) and CPI-U (CPIAUCSL), rebased to April 2026 dollars; latest monthly Brent observation as of 2026-04-01.
Exports
Download plates
This chart puts selected oil shocks on the same constant-dollar yardstick, comparing the latest Brent monthly average with earlier crisis episodes rather than live spot headlines.
The chart shows the latest Brent monthly average, rebased into the same constant-dollar frame, below the real oil spikes from the revolution era, the financial-crisis spike, and the later energy shock, while the Gulf War jump sits below today’s levelfred.stlouisfed.org fred.stlouisfed.org).
Using FRED’s monthly Brent series and CPI-U, the latest reading is $117.29, with 332.407 as the deflator base. On that basis, the revolution-era spike is about ~$162.28, the financial-crisis spike about ~$201.38, and the later energy-shock peak about ~$138.30. The Gulf War jump comes in at about ~$89.78.
Only the revolution-era column uses a pre-Brent proxy, because that episode predates FRED’s Brent history; the Gulf War column comes directly from the Brent series itself. This is a selected-episode comparison rather than a continuous history, so the claim is narrow: in real terms, the latest monthly average is elevated, but it still does not match the bigger inflation-adjusted spikes in the comparison.