Plate ·
Grocery inflation cooled. Prices stayed high.
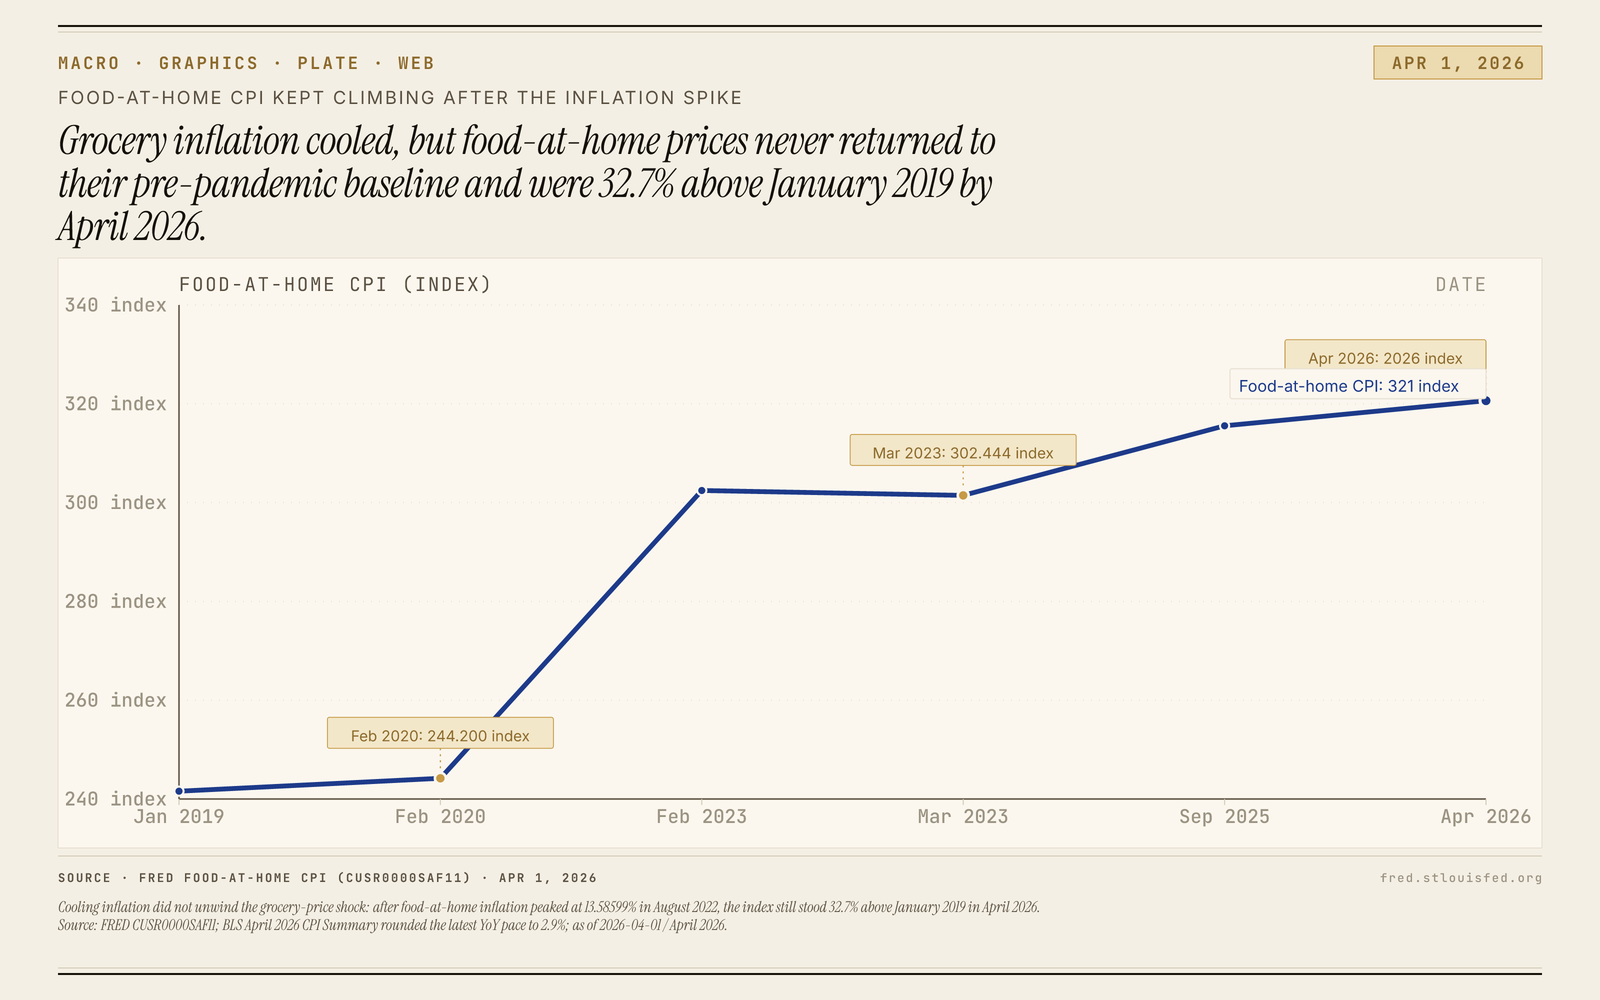
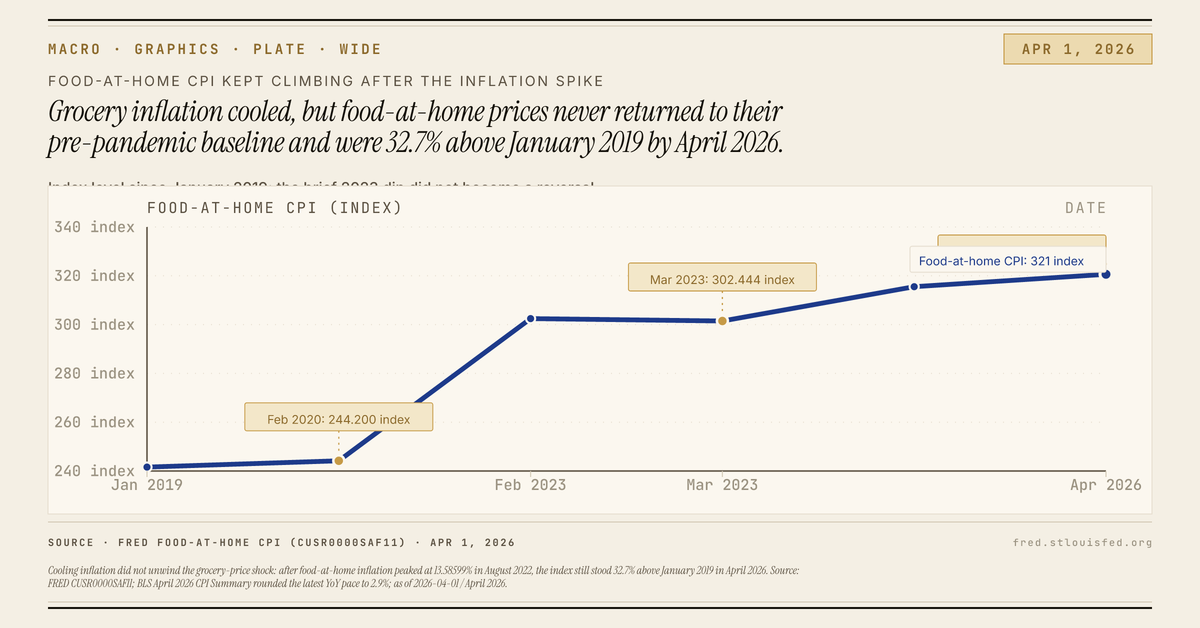
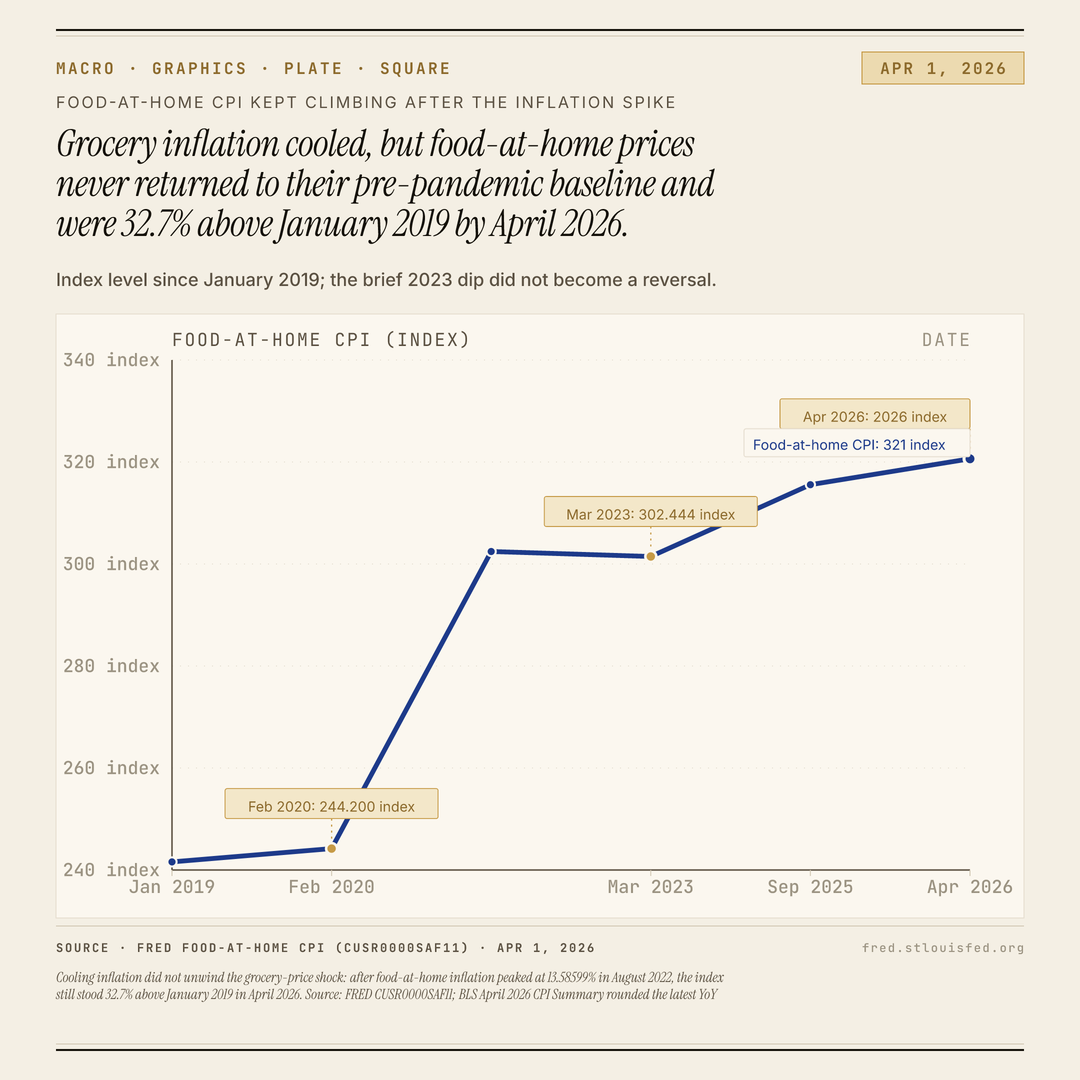
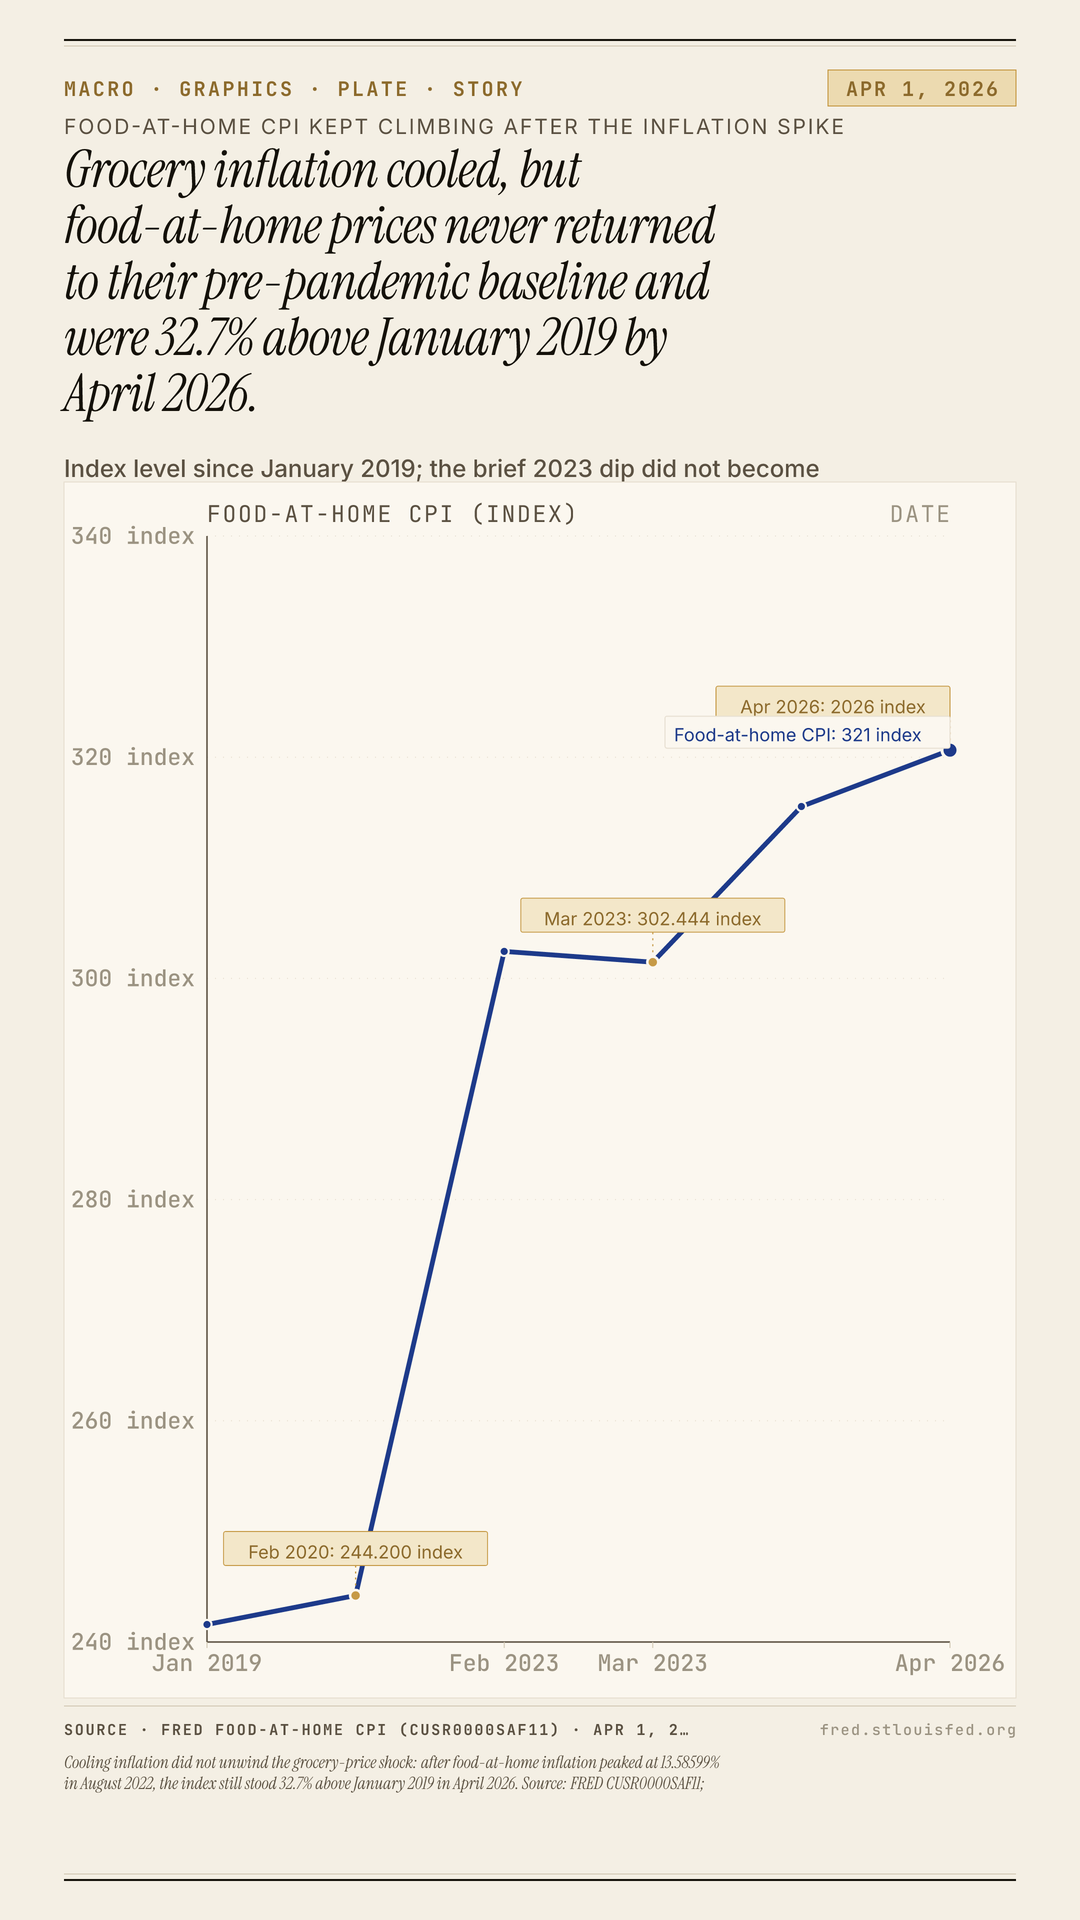
Cooling inflation did not unwind the grocery-price shock: after food-at-home inflation peaked at 13.58599% in August 2022, the index still stood 32.7% above January 2019 in April 2026. Source: FRED CUSR0000SAF11; BLS April 2026 CPI Summary rounded the latest YoY pace to 2.9%; as of 2026-04-01 / April 2026.
Exports
Download plates
This chart shows grocery prices staying high even after inflation cooled: the food-at-home CPI rose from 244.200 before the pandemic to 320.633, and the brief dip from 302.444 to 301.467 did not last fred.stlouisfed.org.
This chart shows the food-at-home CPI ending at 320.633, well above the pre-pandemic 244.200 level, with only a brief dip from 302.444 to 301.467 before the climb resumed fred.stlouisfed.org. That is why the chart is drawn in levels rather than the YoY rate: it captures what shoppers actually face at the register. The YoY pace peaked at 13.58599%, later cooled to 0.91%, and was running at 2.95% in the latest reading, but slower inflation still means prices are rising unless the rate turns negative. That never happened here. Instead, the shock settled into a higher plateau and then pushed higher again, leaving the index 32.7% above the chart’s opening level. The important distinction is simple: easing inflation can slow the pressure on household budgets, but it does not undo the earlier jump in grocery prices.