Plate ·
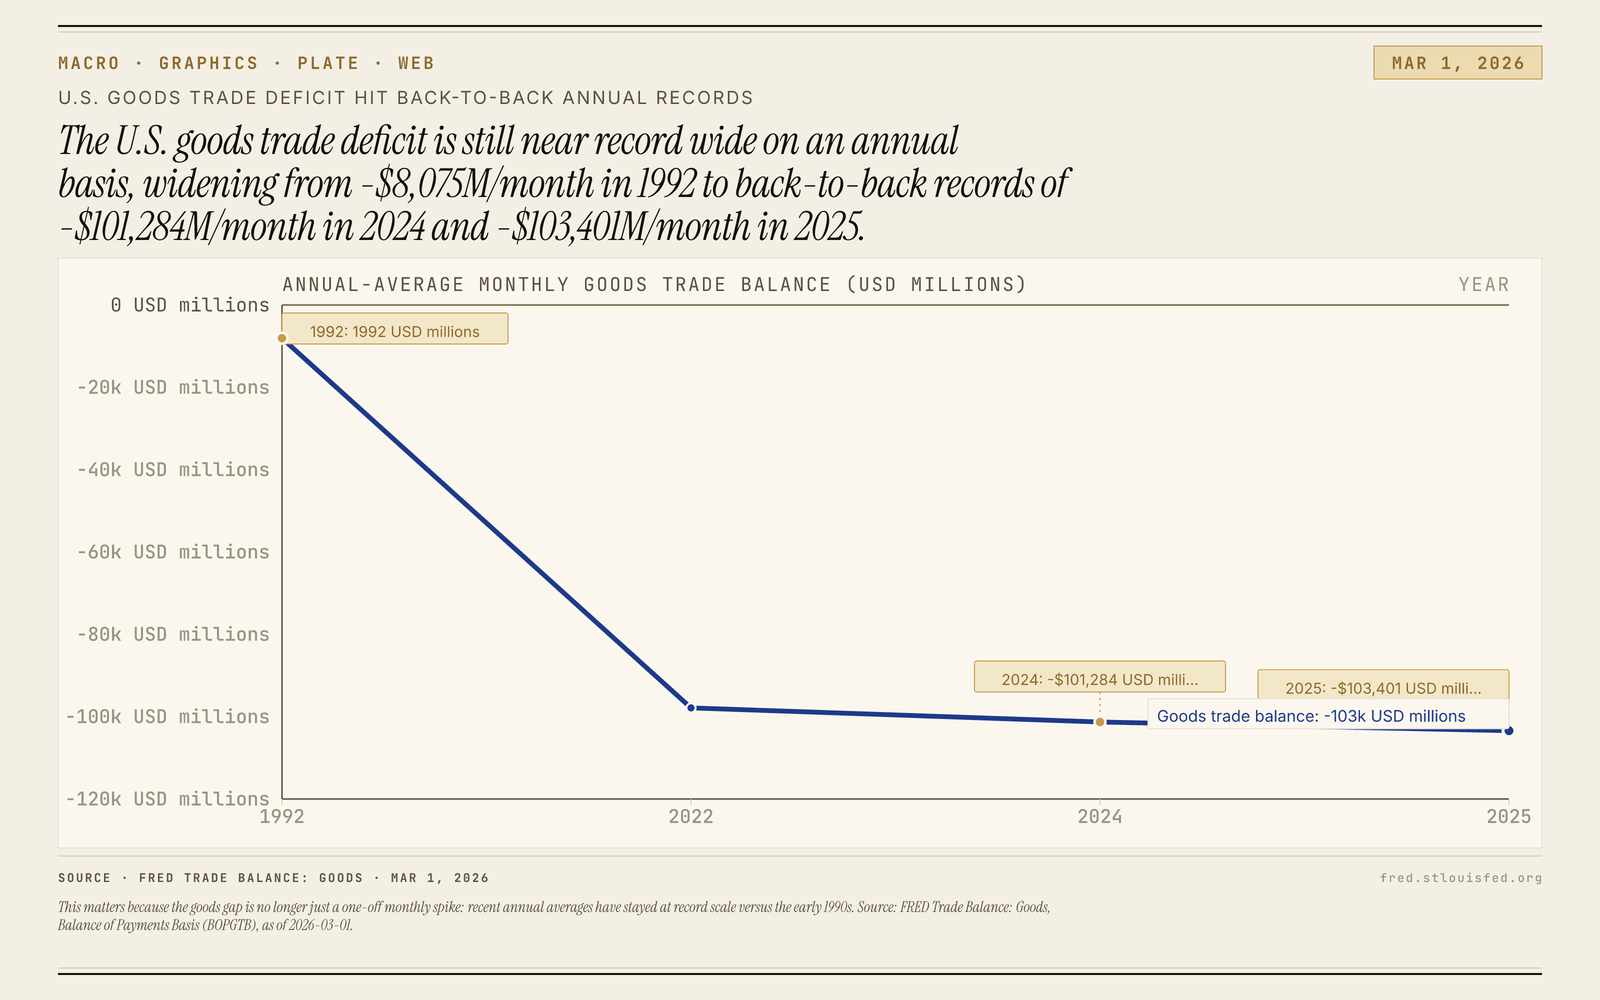
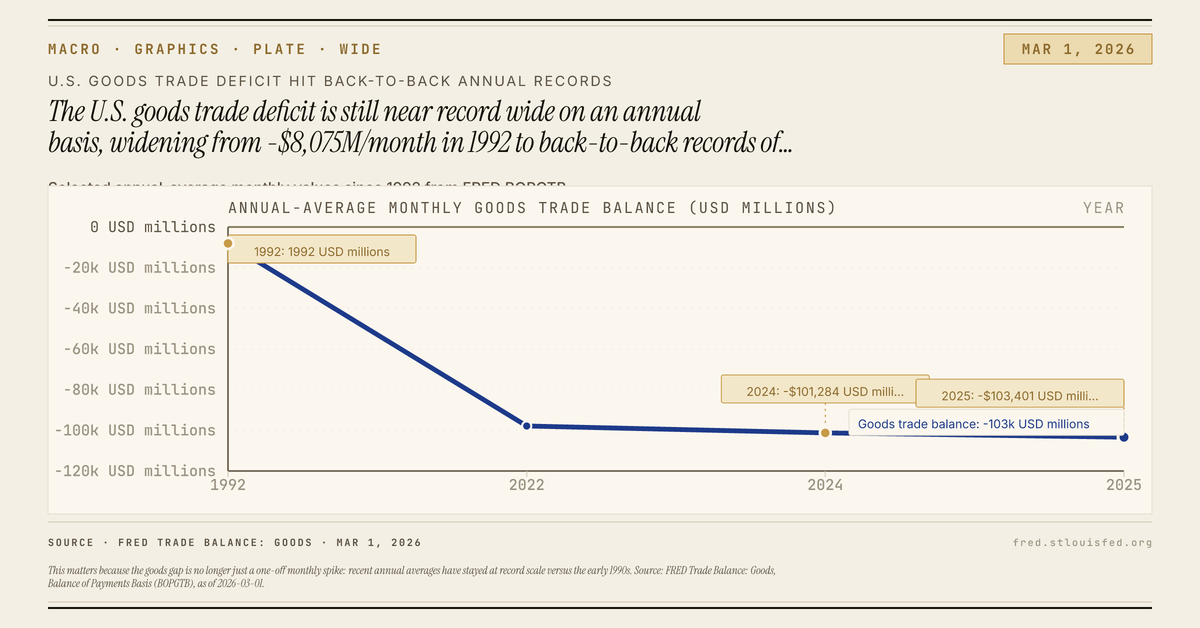
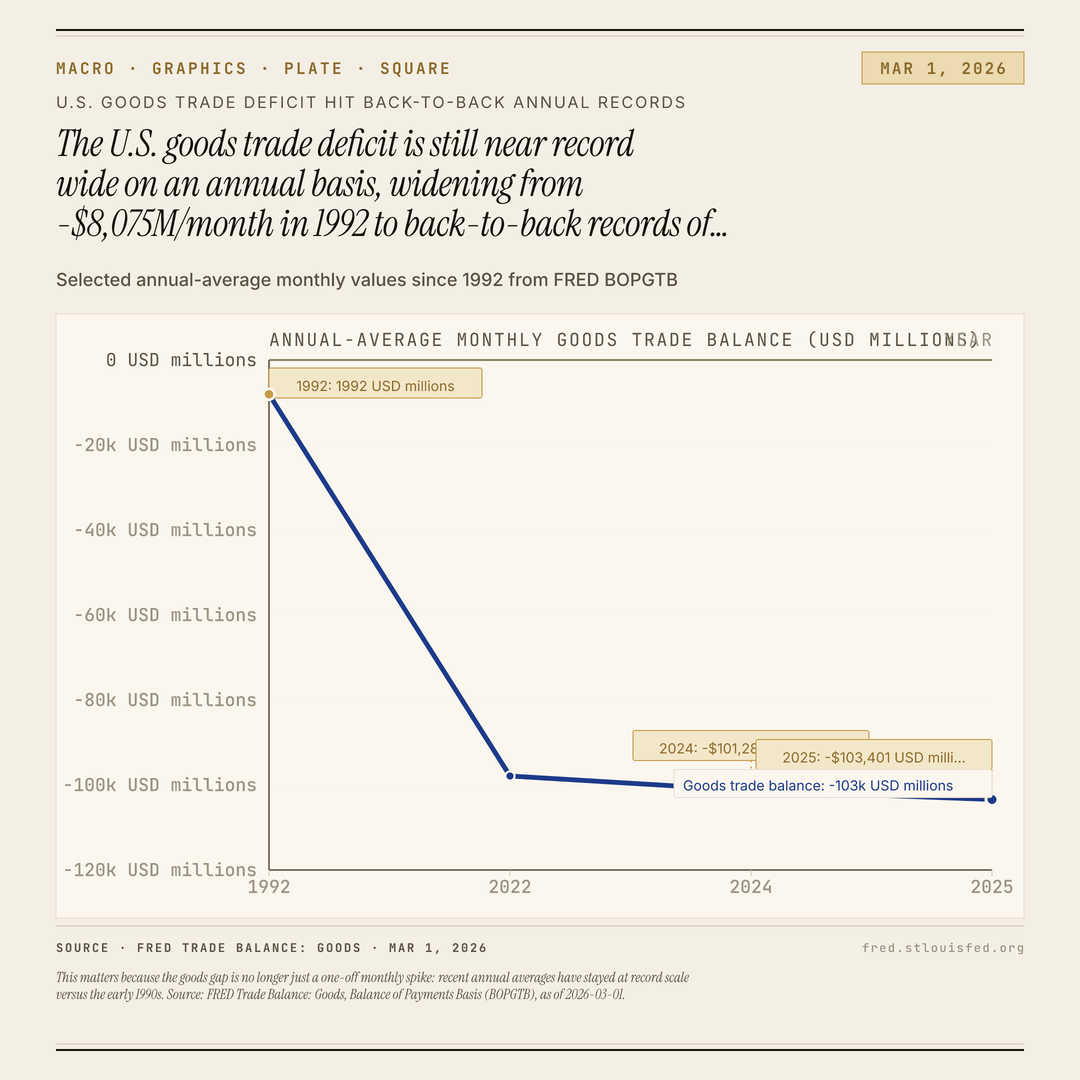
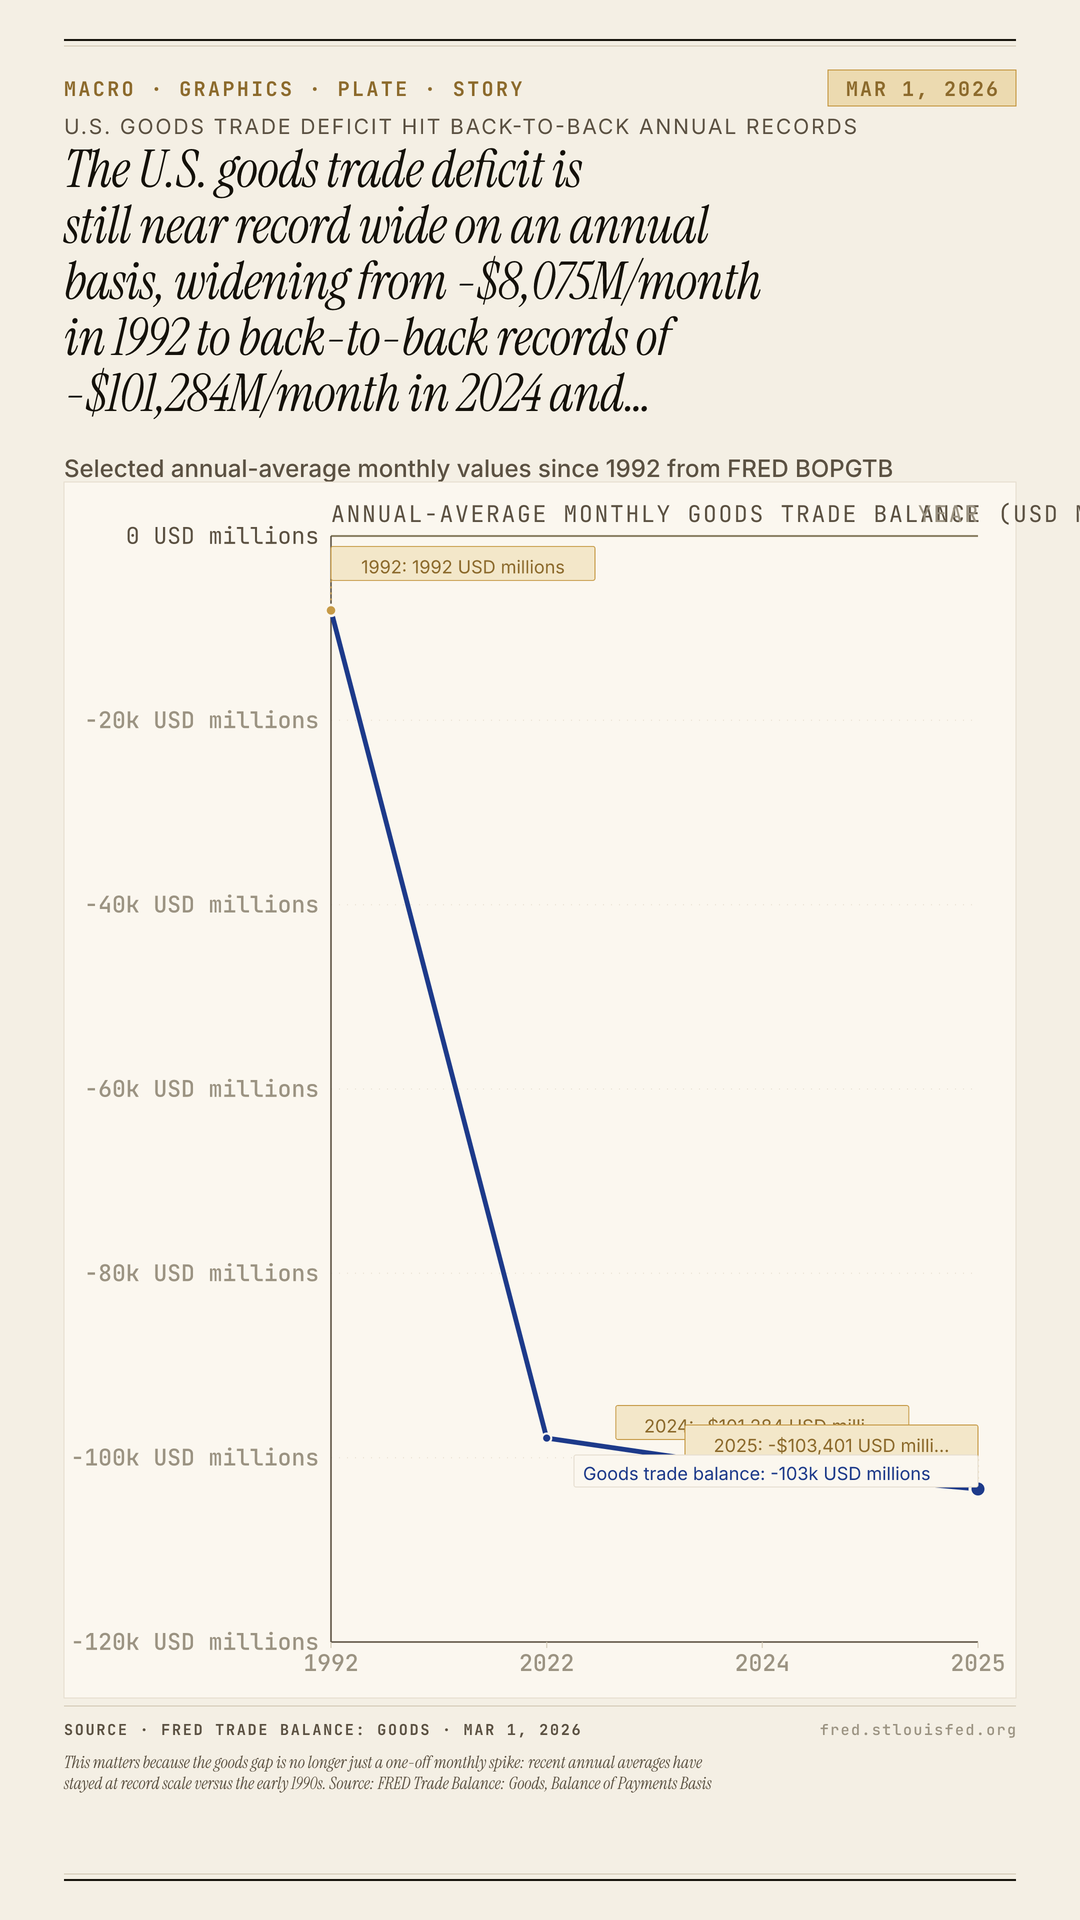
Goods deficit near annual records

This matters because the goods gap is no longer just a one-off monthly spike: recent annual averages have stayed at record scale versus the early 1990s. Source: FRED Trade Balance: Goods, Balance of Payments Basis (BOPGTB), as of 2026-03-01.
Exports
Download plates
This chart shows the U.S. goods trade deficit staying near record wide on an annual basis: the annual-average monthly gap has climbed from a much smaller early-series level to consecutive record readings in the goods-only FRED BOPGTB data fred.stlouisfed.org.
This chart shows the annual-average monthly U.S. goods trade deficit still sitting near its widest readings in the goods-only FRED BOPGTB series fred.stlouisfed.org.
That framing matters because the monthly path was much more volatile than the annual picture. A sharp blowout and subsequent retracement can make the move look temporary if you focus on the most dramatic point alone. The annual view strips out that whiplash. It shows that, even after the spike eased, the goods gap remained wide enough for long enough to keep the broader measure pinned near its extremes.
So the claim here is deliberately narrow. This is not an argument that the latest monthly reading is the worst on record. It is an argument that the goods deficit, measured on an annual-average monthly basis, remains historically large versus the early part of the series. For a chart built to show persistence rather than headline volatility, that is the cleaner read.