Plate ·
Fed timeline: 5.25%-5.50% ranks second
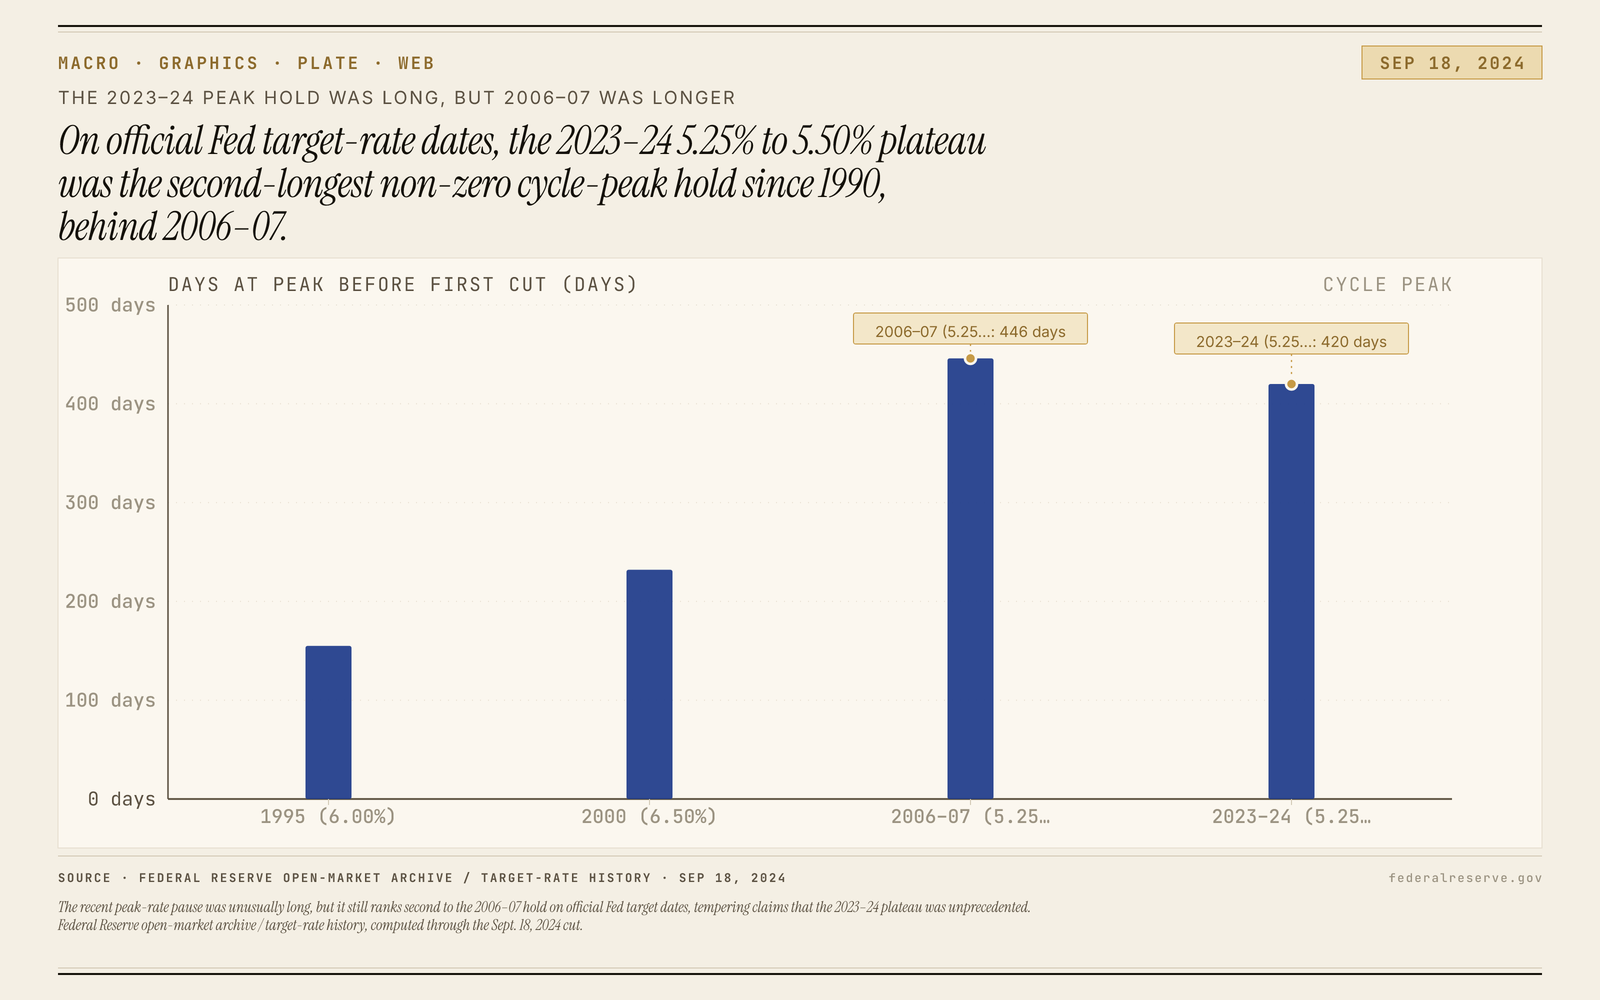
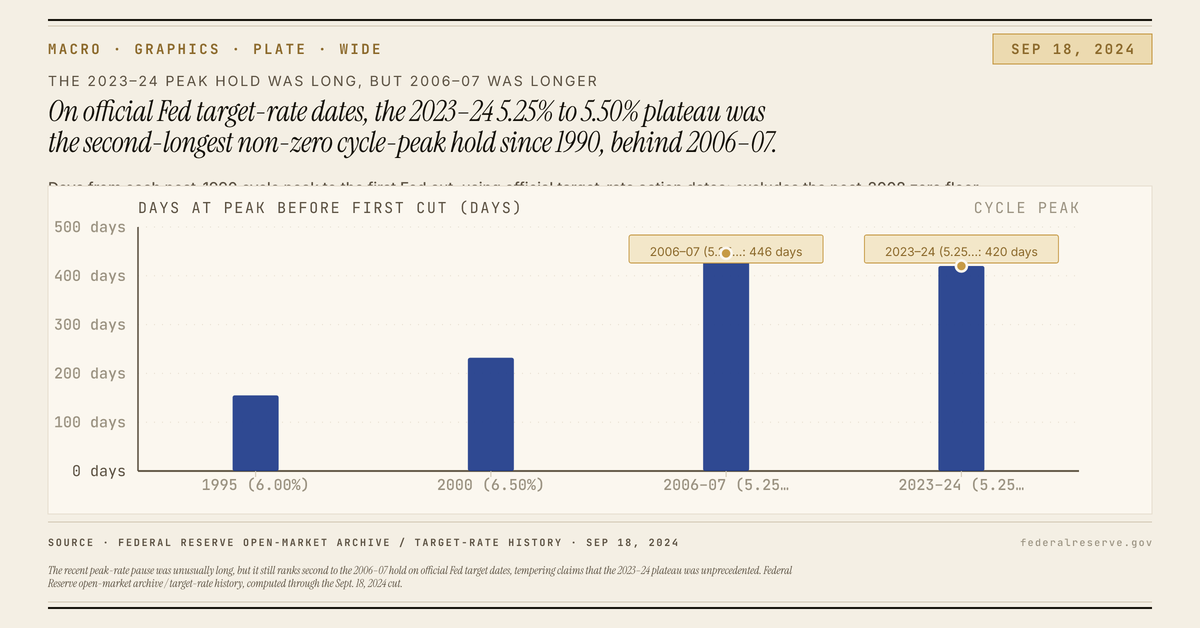
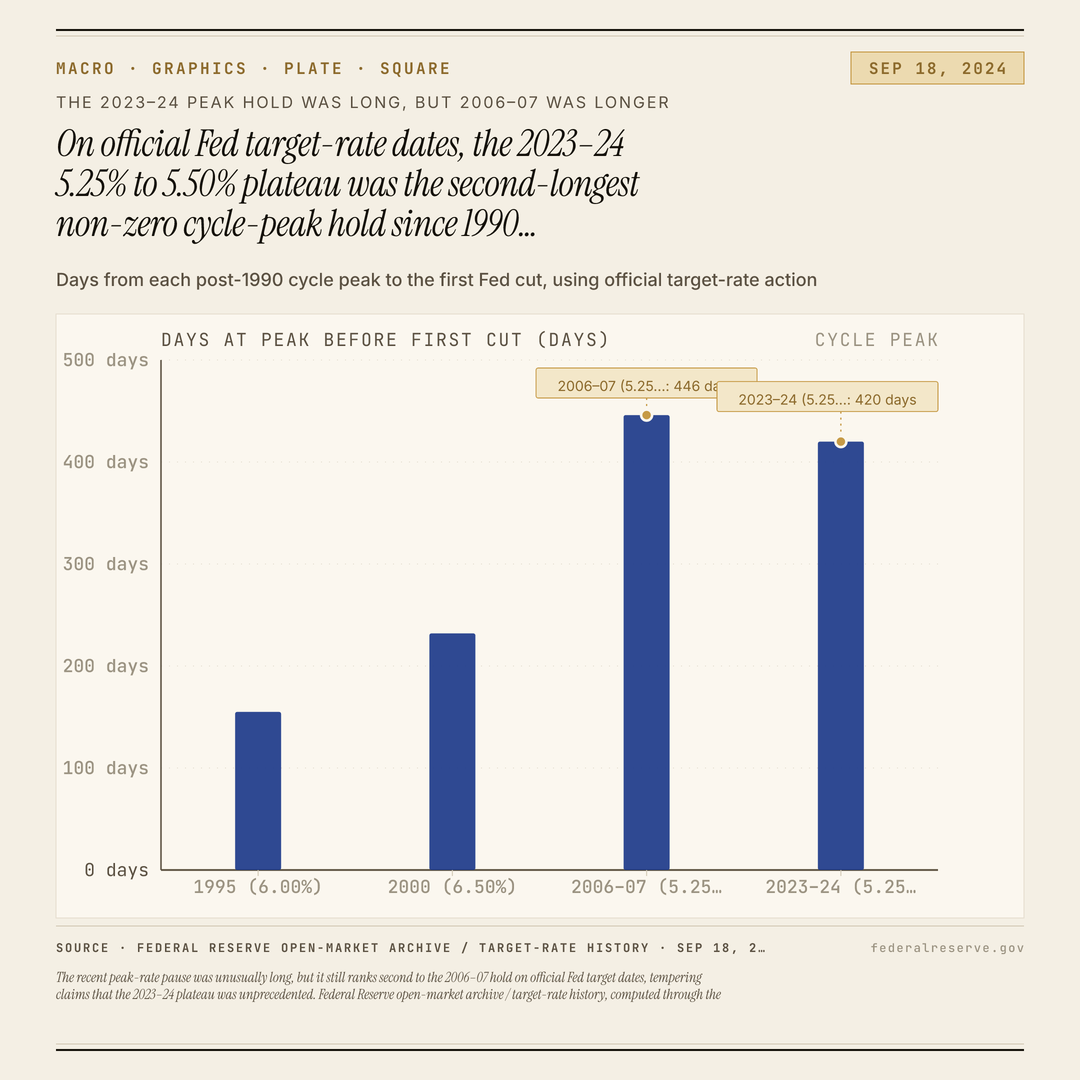
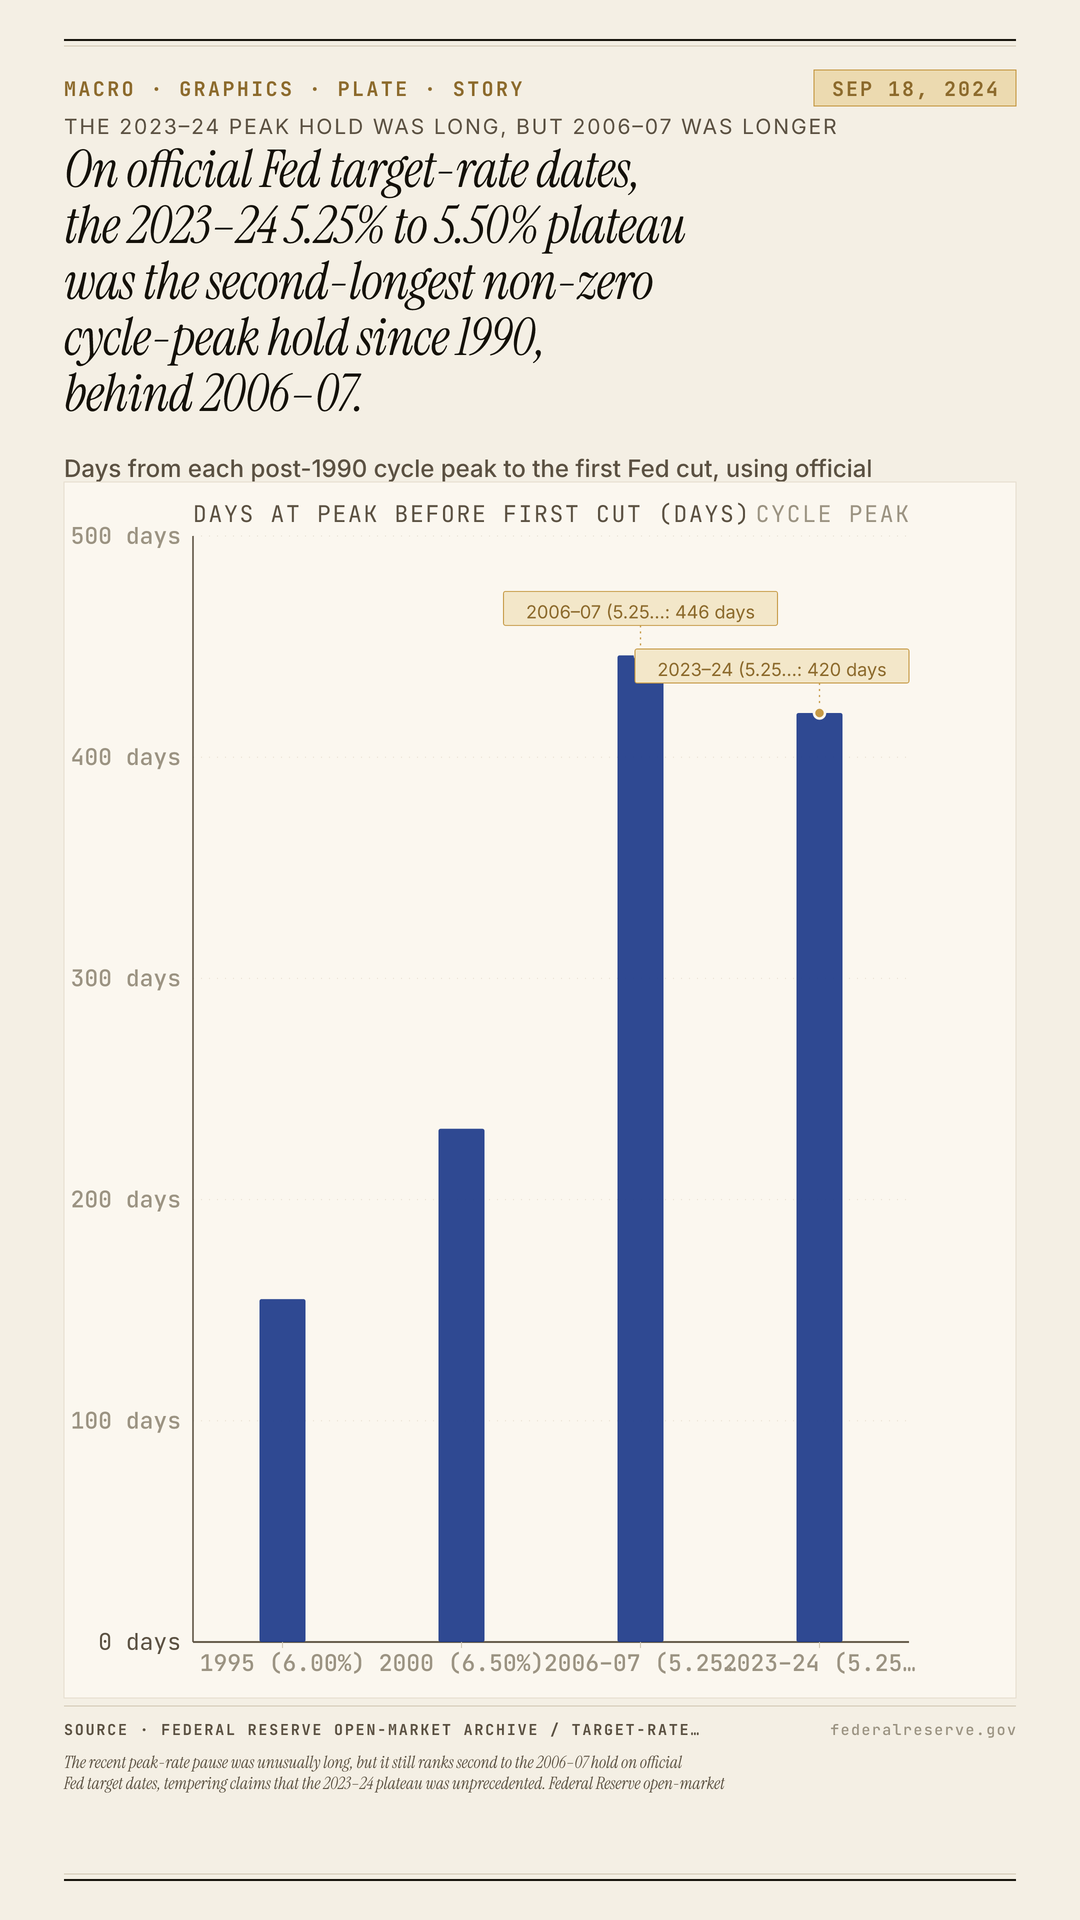
The recent peak-rate pause was unusually long, but it still ranks second to the 2006–07 hold on official Fed target dates, tempering claims that the 2023–24 plateau was unprecedented. Federal Reserve open-market archive / target-rate history, computed through the Sept. 18, 2024 cut.
Exports
Download plates
A pause at the top can look unprecedented until each peak is measured on the Fed’s own target-rate dates. This chart compares those peak holds on one official method.
The chart shows the recent 5.25% to 5.50% peak hold at 420 days, behind the earlier 5.25% peak at 446 days, with 6.50% at 232 days and 6.00% at 155 days (Federal Reserve open-market archive: federalreserve.gov).
That puts the latest plateau second in the modern non-zero set, not first. The distinction is methodological: this chart measures from a cycle peak to the first cut using official target-rate action dates, rather than monthly effective-rate averages that can blur the handoff between a plateau and an easing cycle.
That narrower framing is the point. The latest hold was still extraordinary, and the gap with the prior 5.25% peak is small enough to explain why broader summaries can overstate it. But on the Fed’s own policy chronology—and with the zero floor excluded—the cleaner claim is that the pause at 5.25% to 5.50% was very long, just not the longest.