Plate ·
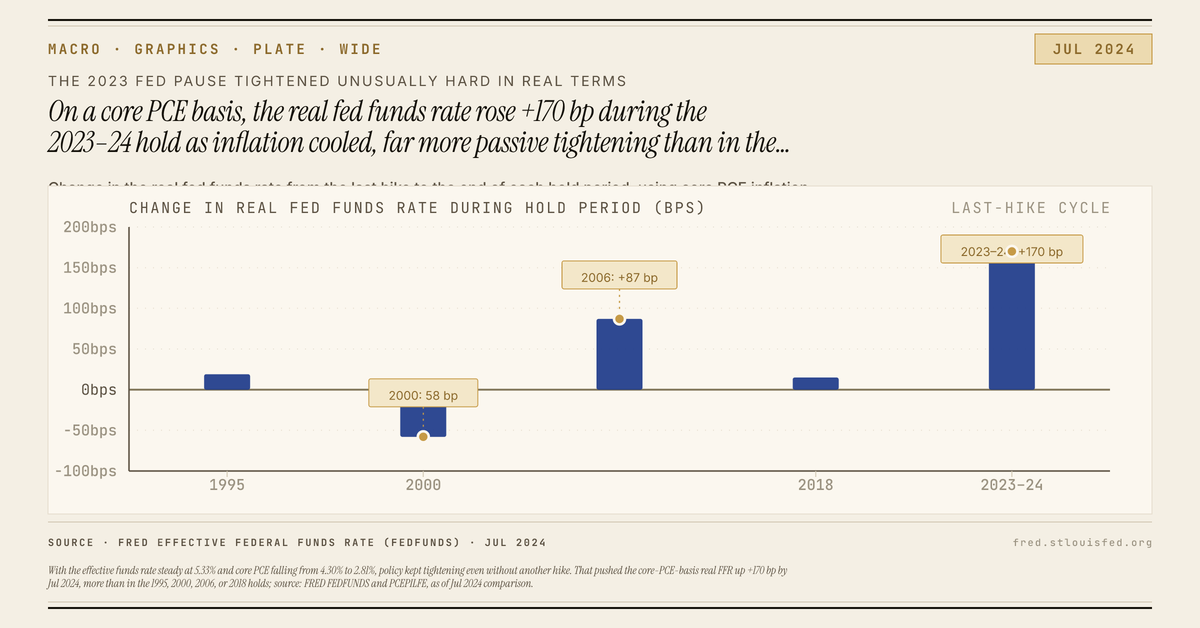
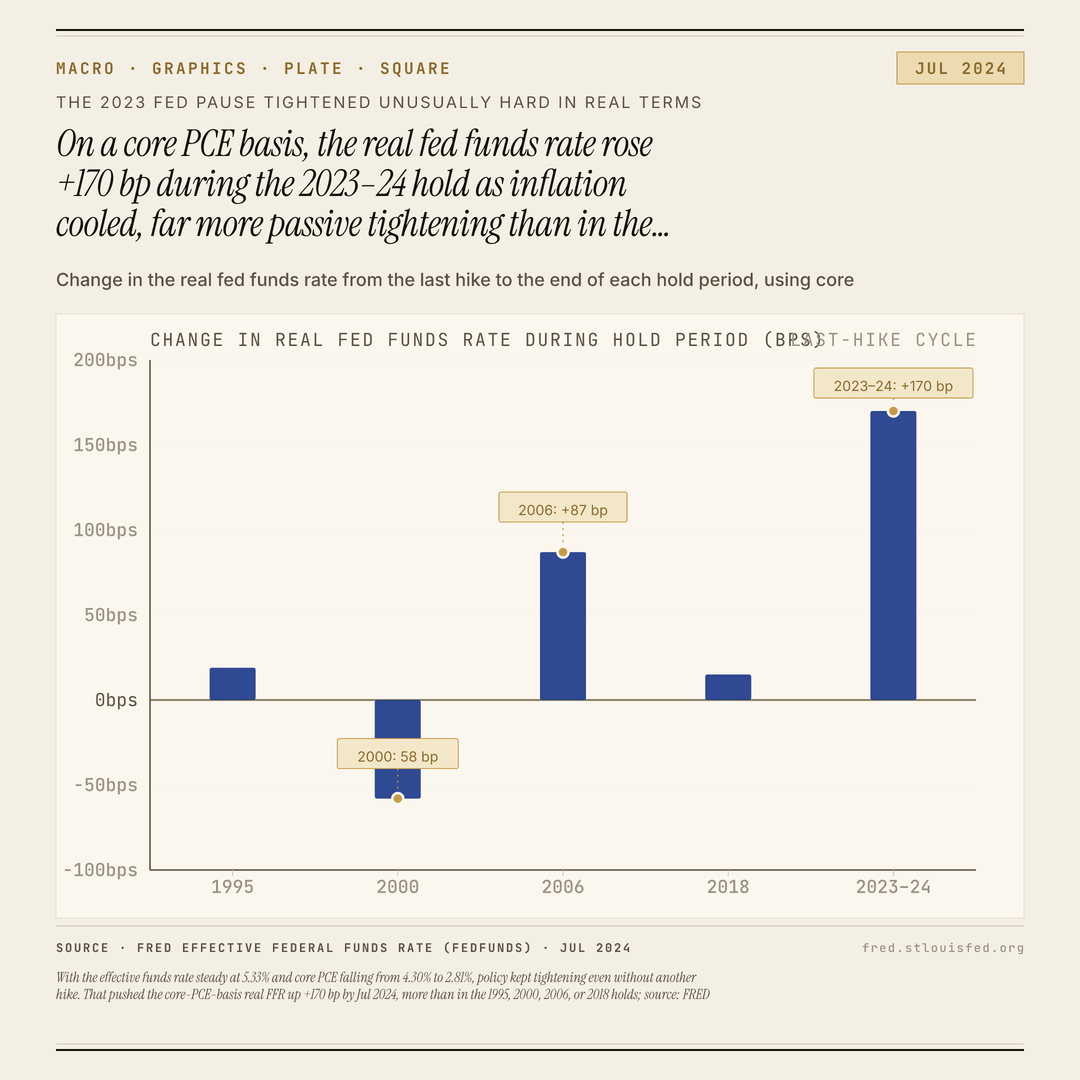
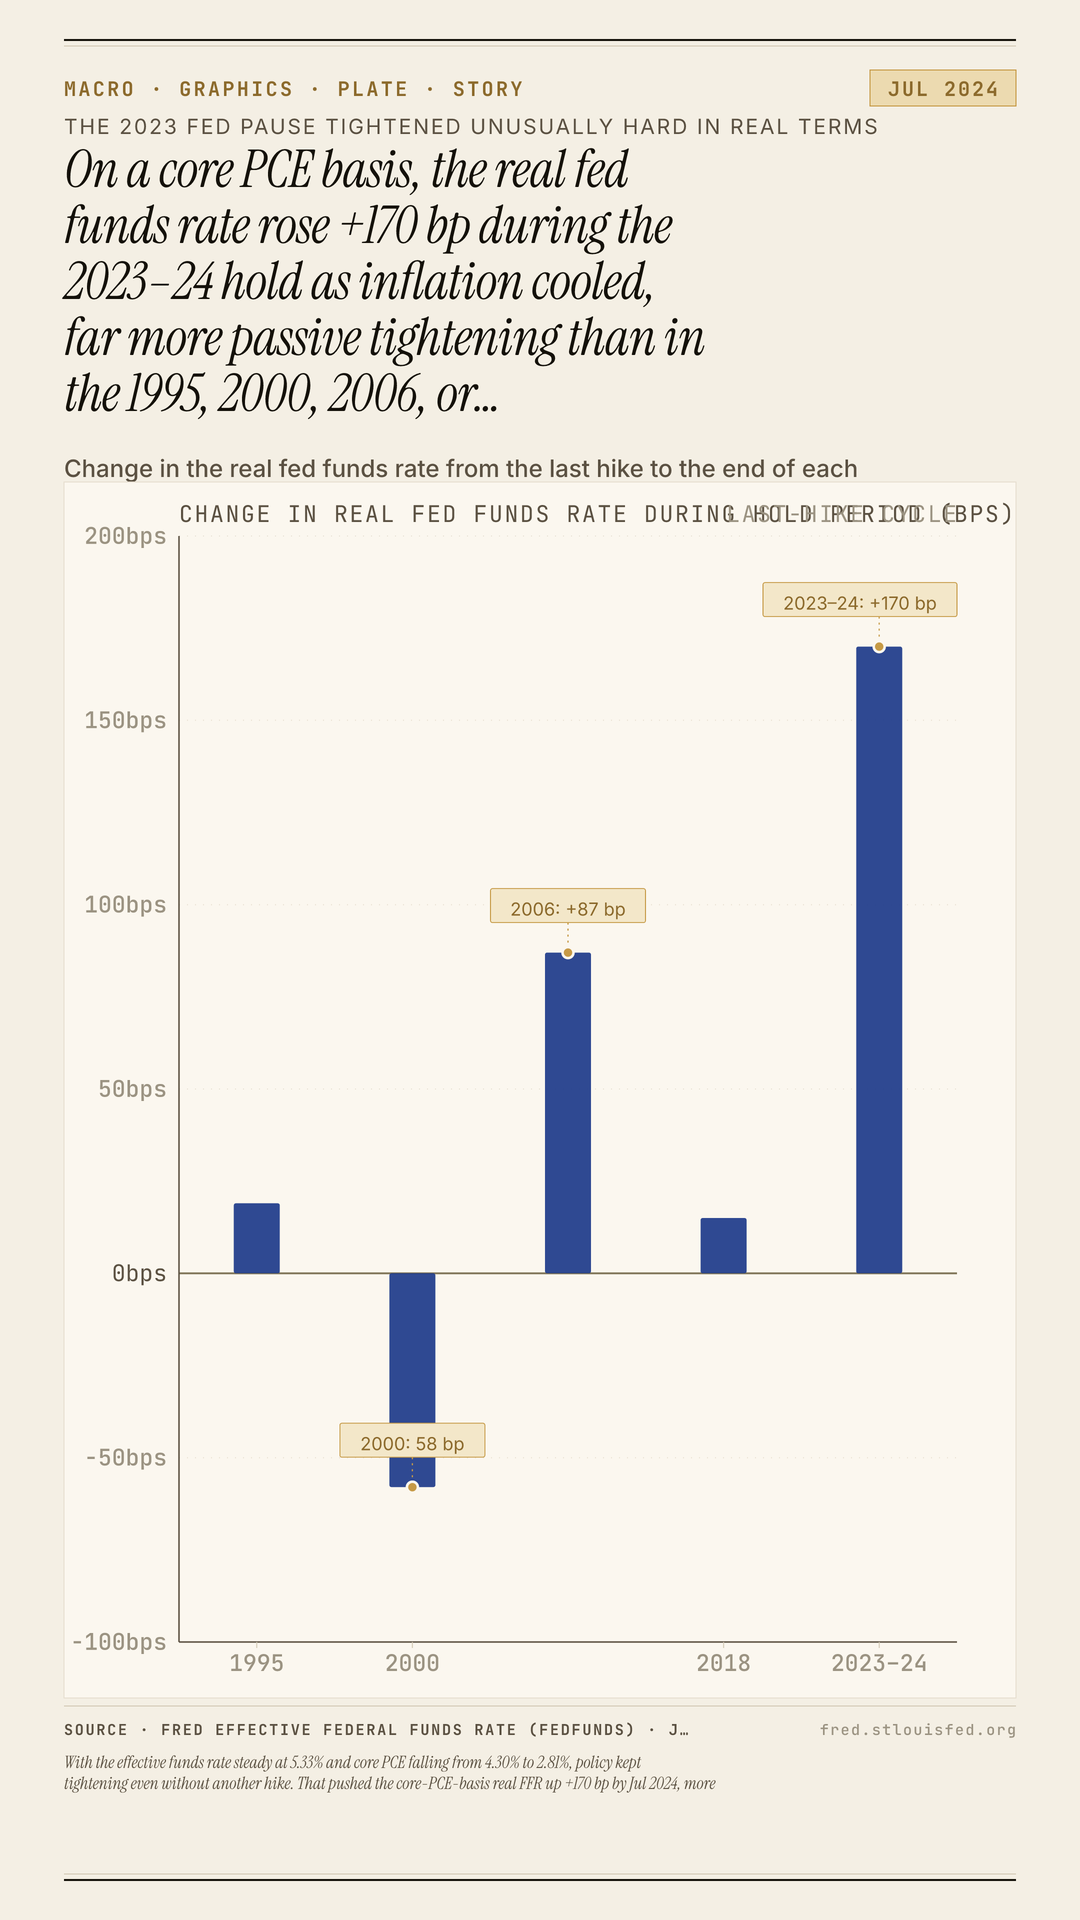
Fed pause kept tightening in real terms
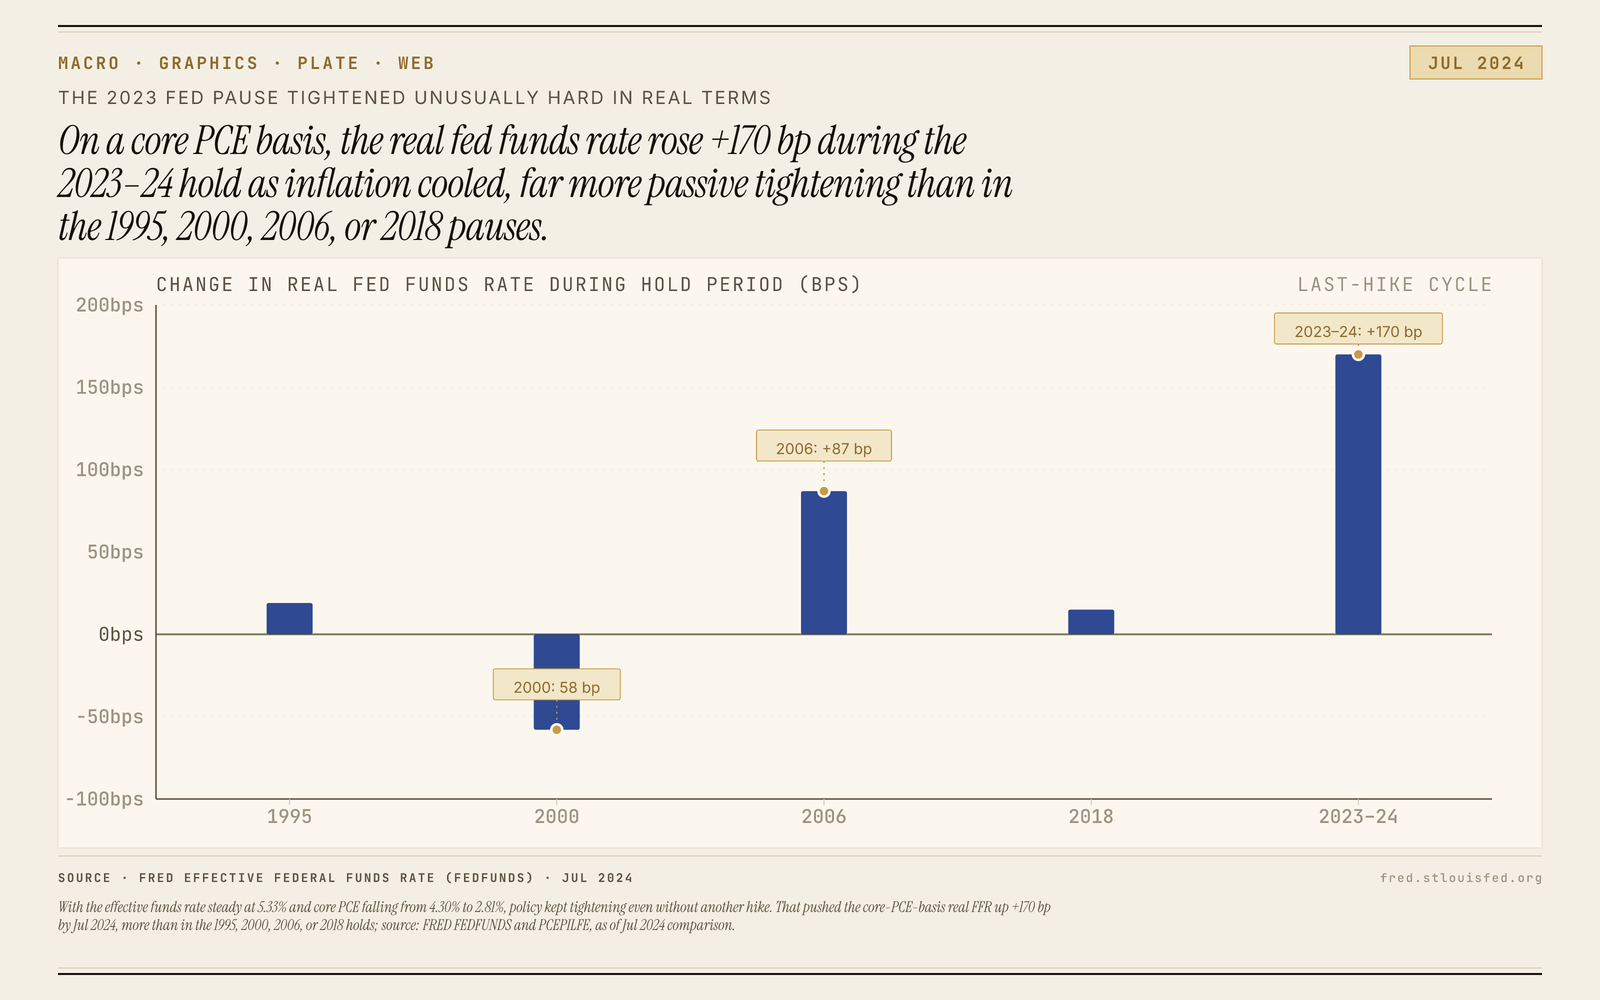
With the effective funds rate steady at 5.33% and core PCE falling from 4.30% to 2.81%, policy kept tightening even without another hike. That pushed the core-PCE-basis real FFR up +170 bp by Jul 2024, more than in the 1995, 2000, 2006, or 2018 holds; source: FRED FEDFUNDS and PCEPILFE, as of Jul 2024 comparison.
Exports
Download plates
The chart shows the real fed funds rate climbing during the latest hold as inflation cooled, with the effective rate at 5.33% and core PCE falling from 4.30% to 2.81%.
The chart shows the real fed funds rate rising +170 bp during the latest hold, from +0.82% to +2.52%, as core PCE cooled from 4.30% to 2.81% while the effective funds rate sat at 5.33% (FRED: fred.stlouisfed.org).
That is what made this pause unusual on a core PCE basis. Once the nominal policy rate stopped moving, disinflation kept doing the tightening. The last hike also left the target range at 5.25%–5.50%, the highest in 22 years, so a falling inflation rate translated directly into a higher real policy rate.
The comparison in the chart is about drift, not every cycle’s starting level. On this measure, the latest hold saw far more passive tightening than the earlier pauses shown here. And the effect did not vanish immediately: even after later cuts, the real fed funds rate was still +1.72%, or 90 bp above the level at the last hike. The point is simple: policy can keep getting more restrictive even when the Fed is no longer hiking.